
Key points:
-
Bitcoin seeks consolidation after rapid gains as stocks and the US dollar surge on US-China trade deal news.
-
Nearby order book liquidity forms potential targets for traders, which now include $102,000.
-
A classic moving average retest suggests that a new all-time high should result.
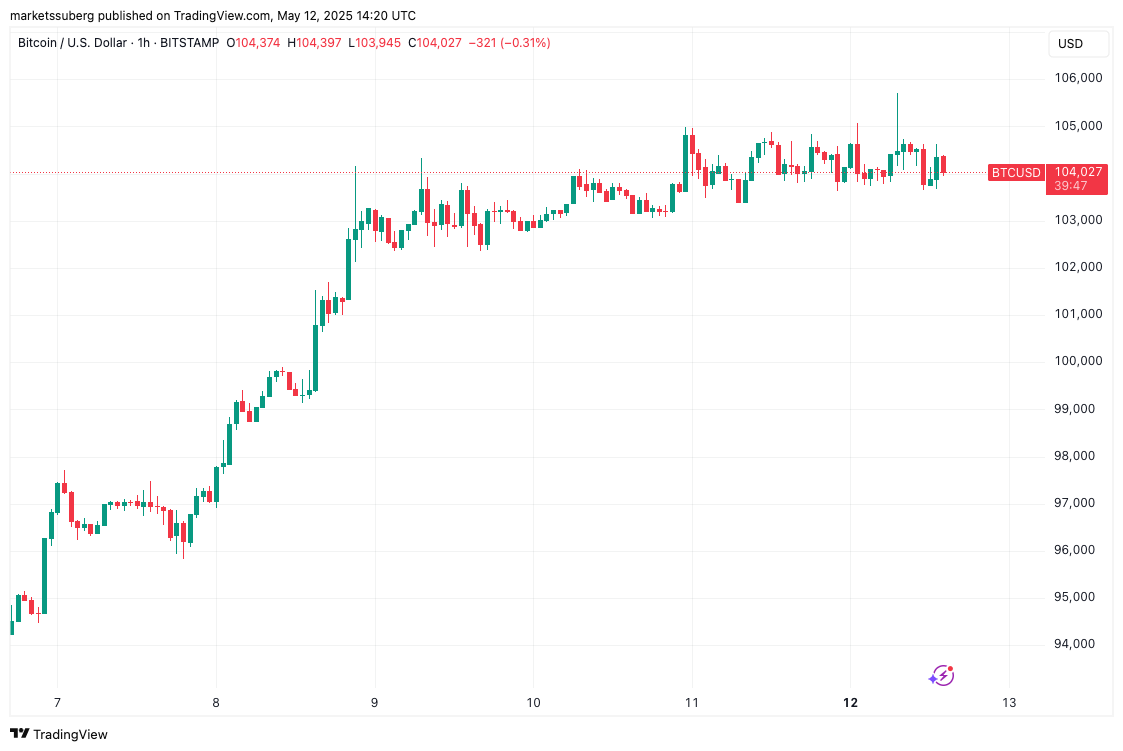
Bitcoin (BTC) stuck to $104,000 at the May 12 Wall Street open as markets shifted on US-China trade deal news.
Bitcoin surfs US-China trade deal reactions
Data from Cointelegraph Markets Pro and TradingView showed BTC/USD consolidating after hitting its highest levels since late January.
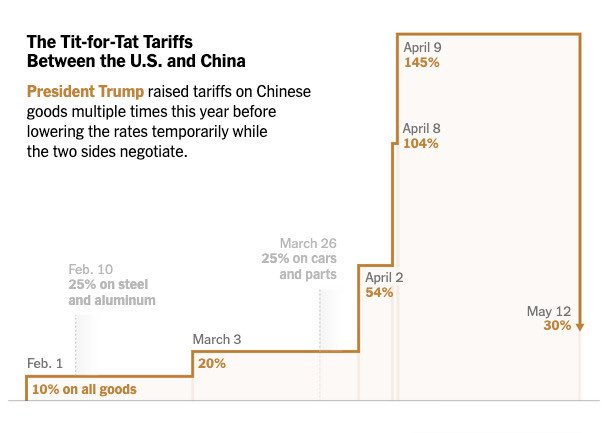
The US and China agreed to slash reciprocal trade tariffs on the day, causing the S&P 500 and Nasdaq Composite Index to gain around 3%.
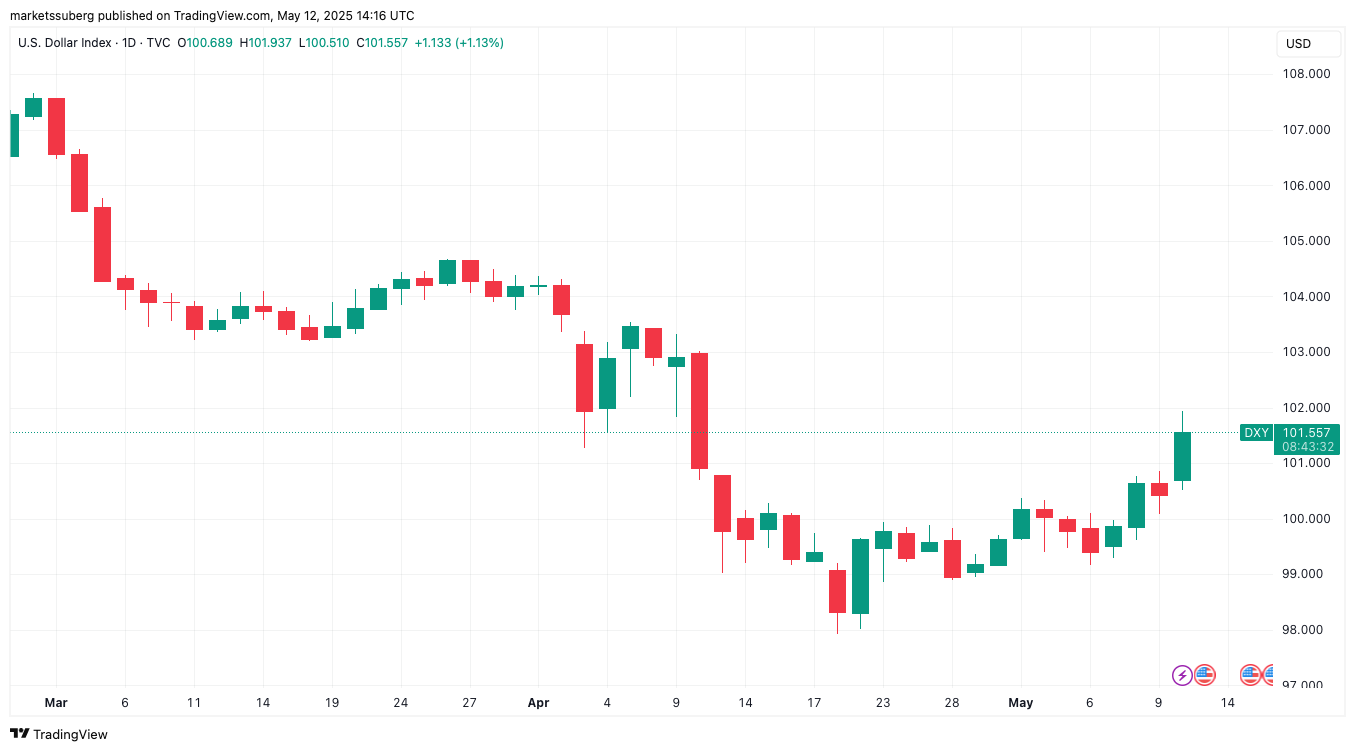
US dollar strength also benefited as a result, with the US dollar index (DXY) hitting one-month highs.
“The last time US tariffs on China were this high, the S&P 500 was ~200 points lower, 4 Fed rate cuts were expected in 2025, and Wall Street was calling for a recession,” trading resource The Kobeissi Letter wrote in part of ongoing analysis on X.
“Sentiment is everything.”
Bitcoin thus adopted the middle ground between major assets on the day as gold dropped precipitously to $3,208 per ounce, nearing month-to-date lows.
“BTC Swept most nearby liquidity above after chopping around the $103K-$105K area for a few days,” popular trader Daan Crypto Trades told X followers alongside a chart of exchange order book liquidity from monitoring resource CoinGlass.
“Below keep an eye on the ~$102K region as that’s a pretty dense area in terms of liquidation clusters. Could be a good level for some action. Depending on the reaction there you can reassess.”
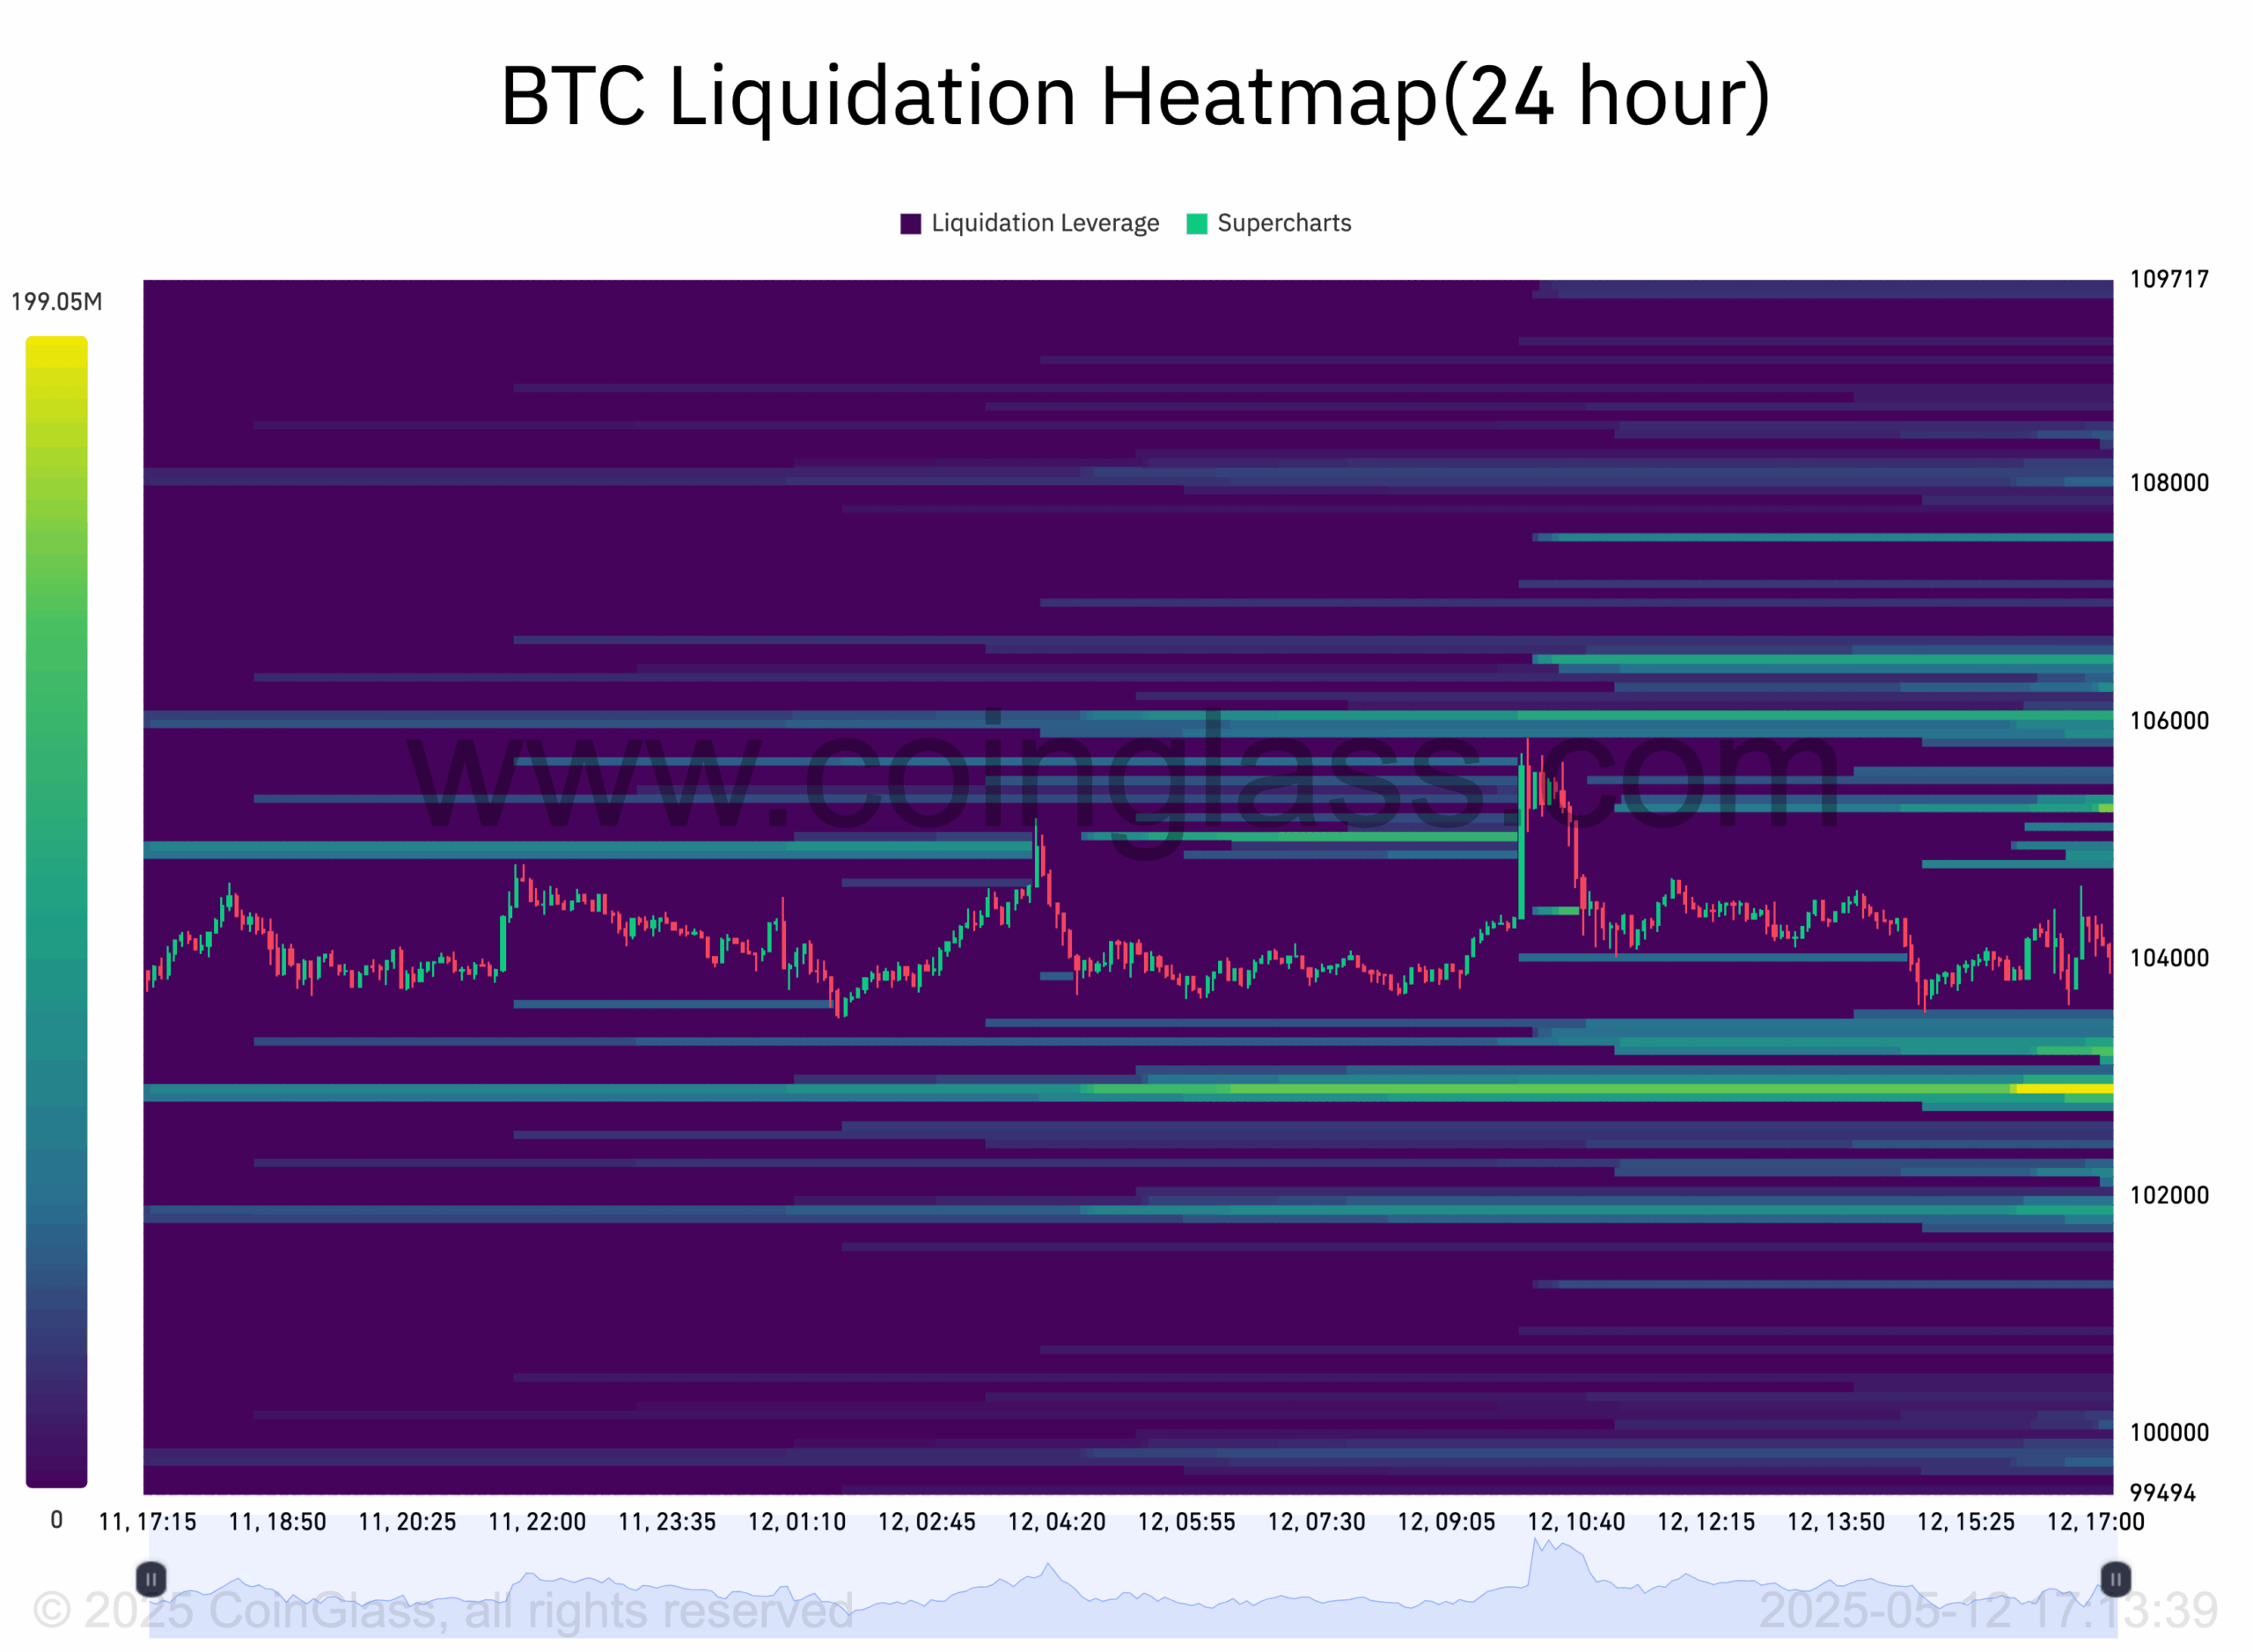
CoinGlass data showed increasing bids around the $103,000 mark after the Wall Street open.
New BTC price record “in the making”
Continuing, fellow trader CrypNuevo was among those doubling down on a longer-term bull thesis for BTC price action.
Related: Is Bitcoin about to go parabolic? BTC price targets include $160K next
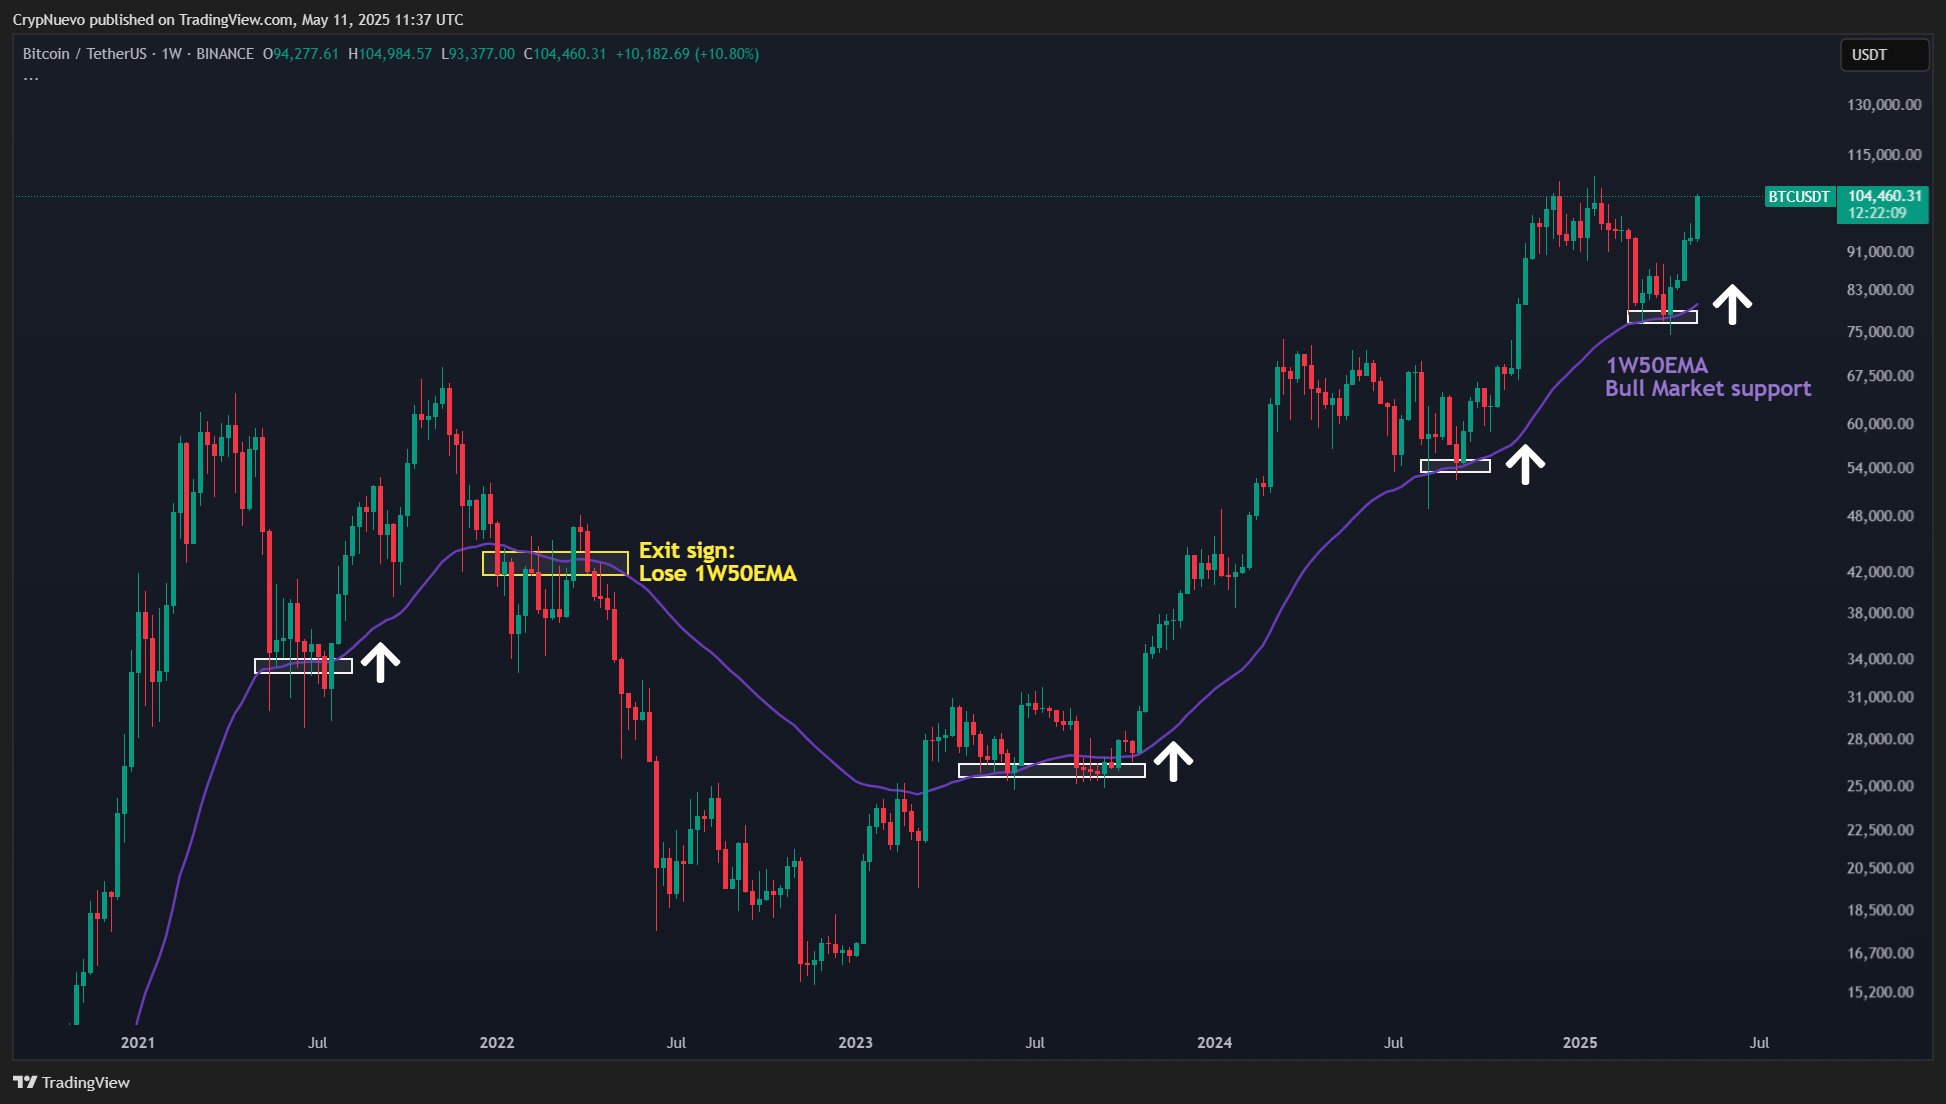
BTC/USD, he noted, had conducted a successful retest of the 50-week exponential moving average (EMA).
Currently at $80,300, the 50-week EMA has functioned as a springboard for new all-time highs in recent years.
“We got the 1W50EMA retest and, consequently, the next leg up,” CrypNuevo explained in an X thread on May 11.
“Every previous time that we saw this structure, we made a new high so the trend signals a new ATH in the making.”
Earlier, Cointelegraph reported on a classic bull market breakout signal on weekly timeframes in the form of a cross on the moving average convergence/divergence (MACD) indicator.
This article does not contain investment advice or recommendations. Every investment and trading move involves risk, and readers should conduct their own research when making a decision.