
Bitcoin faced a turbulent Sunday as price action delivered a sharp twist, surging to fresh local highs of $107,000 before swiftly retracing to $102,000 within hours. This sudden spike and drop shocked investors who were gearing up for a steady breakout into price discovery. The dramatic move underscored growing market uncertainty, with volatility rising just as many expected a sustained bullish push above the all-time high near $109,000.
Despite the pullback, on-chain data points to underlying strength in the current market structure. Insights from CryptoQuant reveal that the Bitcoin Heat Macro Phase Model stands at 0.41, well below the 0.70 level that historically signals overheated market conditions. This suggests Bitcoin still has room to grow before entering the late-phase distribution zone often seen at cycle tops.
The market now stands at a critical juncture. While some traders view the retrace as a healthy correction within a broader uptrend, others fear it may mark the beginning of a deeper move to the downside. With sentiment split and macro data pointing toward more upside potential, the coming days will be pivotal in determining whether Bitcoin resumes its rally or takes a breather before the next leg up.
Bitcoin Faces Key Support Test
Bitcoin is at a pivotal moment as bulls attempt to defend the psychological $100,000 support level after Sunday’s volatility. Price surged past $107,000 before sharply correcting to $102,000, highlighting the fragility of bullish momentum. While bulls remain in control, they must maintain price action above $100K to keep the structure intact and prevent a deeper retracement.
Resistance remains heavy near the $105,000 zone, just below the all-time high around $109,000. Liquidity above these levels may attract upward momentum if buying pressure returns. However, Bitcoin continues to face consistent short positioning, with traders betting against further upside. This has added pressure and may delay a breakout unless bulls reclaim dominance in the coming sessions.
On-chain analyst Axel Adler shared a critical insight via X, citing a composite indicator based on multiple key metrics: MVRV Z-score, aSOPR, Delta LTH-STH, and ETF flow momentum. These elements are normalized into a fast-moving oscillator designed to identify macro accumulation and distribution zones. The current reading of 0.41 suggests that Bitcoin remains far from overheated conditions, sitting 41% below the 0.70 threshold that typically signals late-cycle peaks and heavy profit-taking.
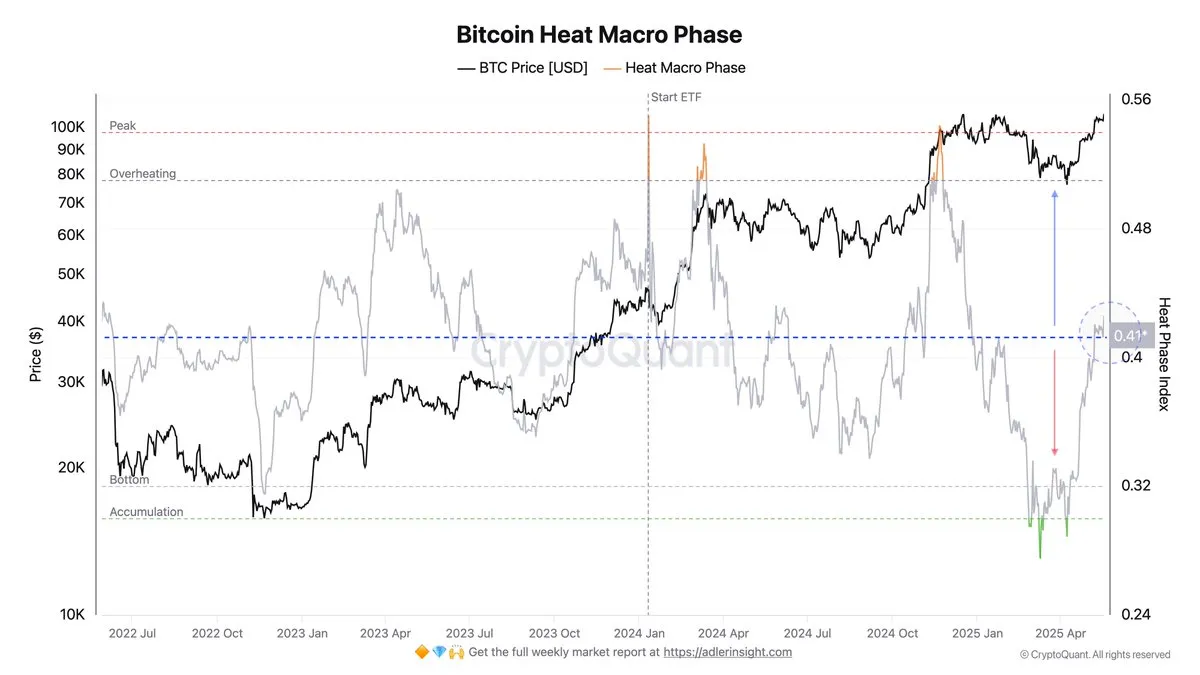
According to Adler, this positioning indicates room for continued upside, especially if macro tailwinds align. While price may experience turbulence near resistance, the underlying on-chain structure supports the possibility of further gains, provided bulls hold the line.
BTC Faces Pullback After Failed Breakout
The 4-hour Bitcoin chart shows high volatility following a breakout attempt that pushed BTC to $107K before sharply reversing. The price failed to hold above the key $103,600 resistance-turned-support zone and has now slipped back to $102,956, raising concerns about a deeper correction. The quick rejection highlights heavy overhead supply and a lack of follow-through from buyers.
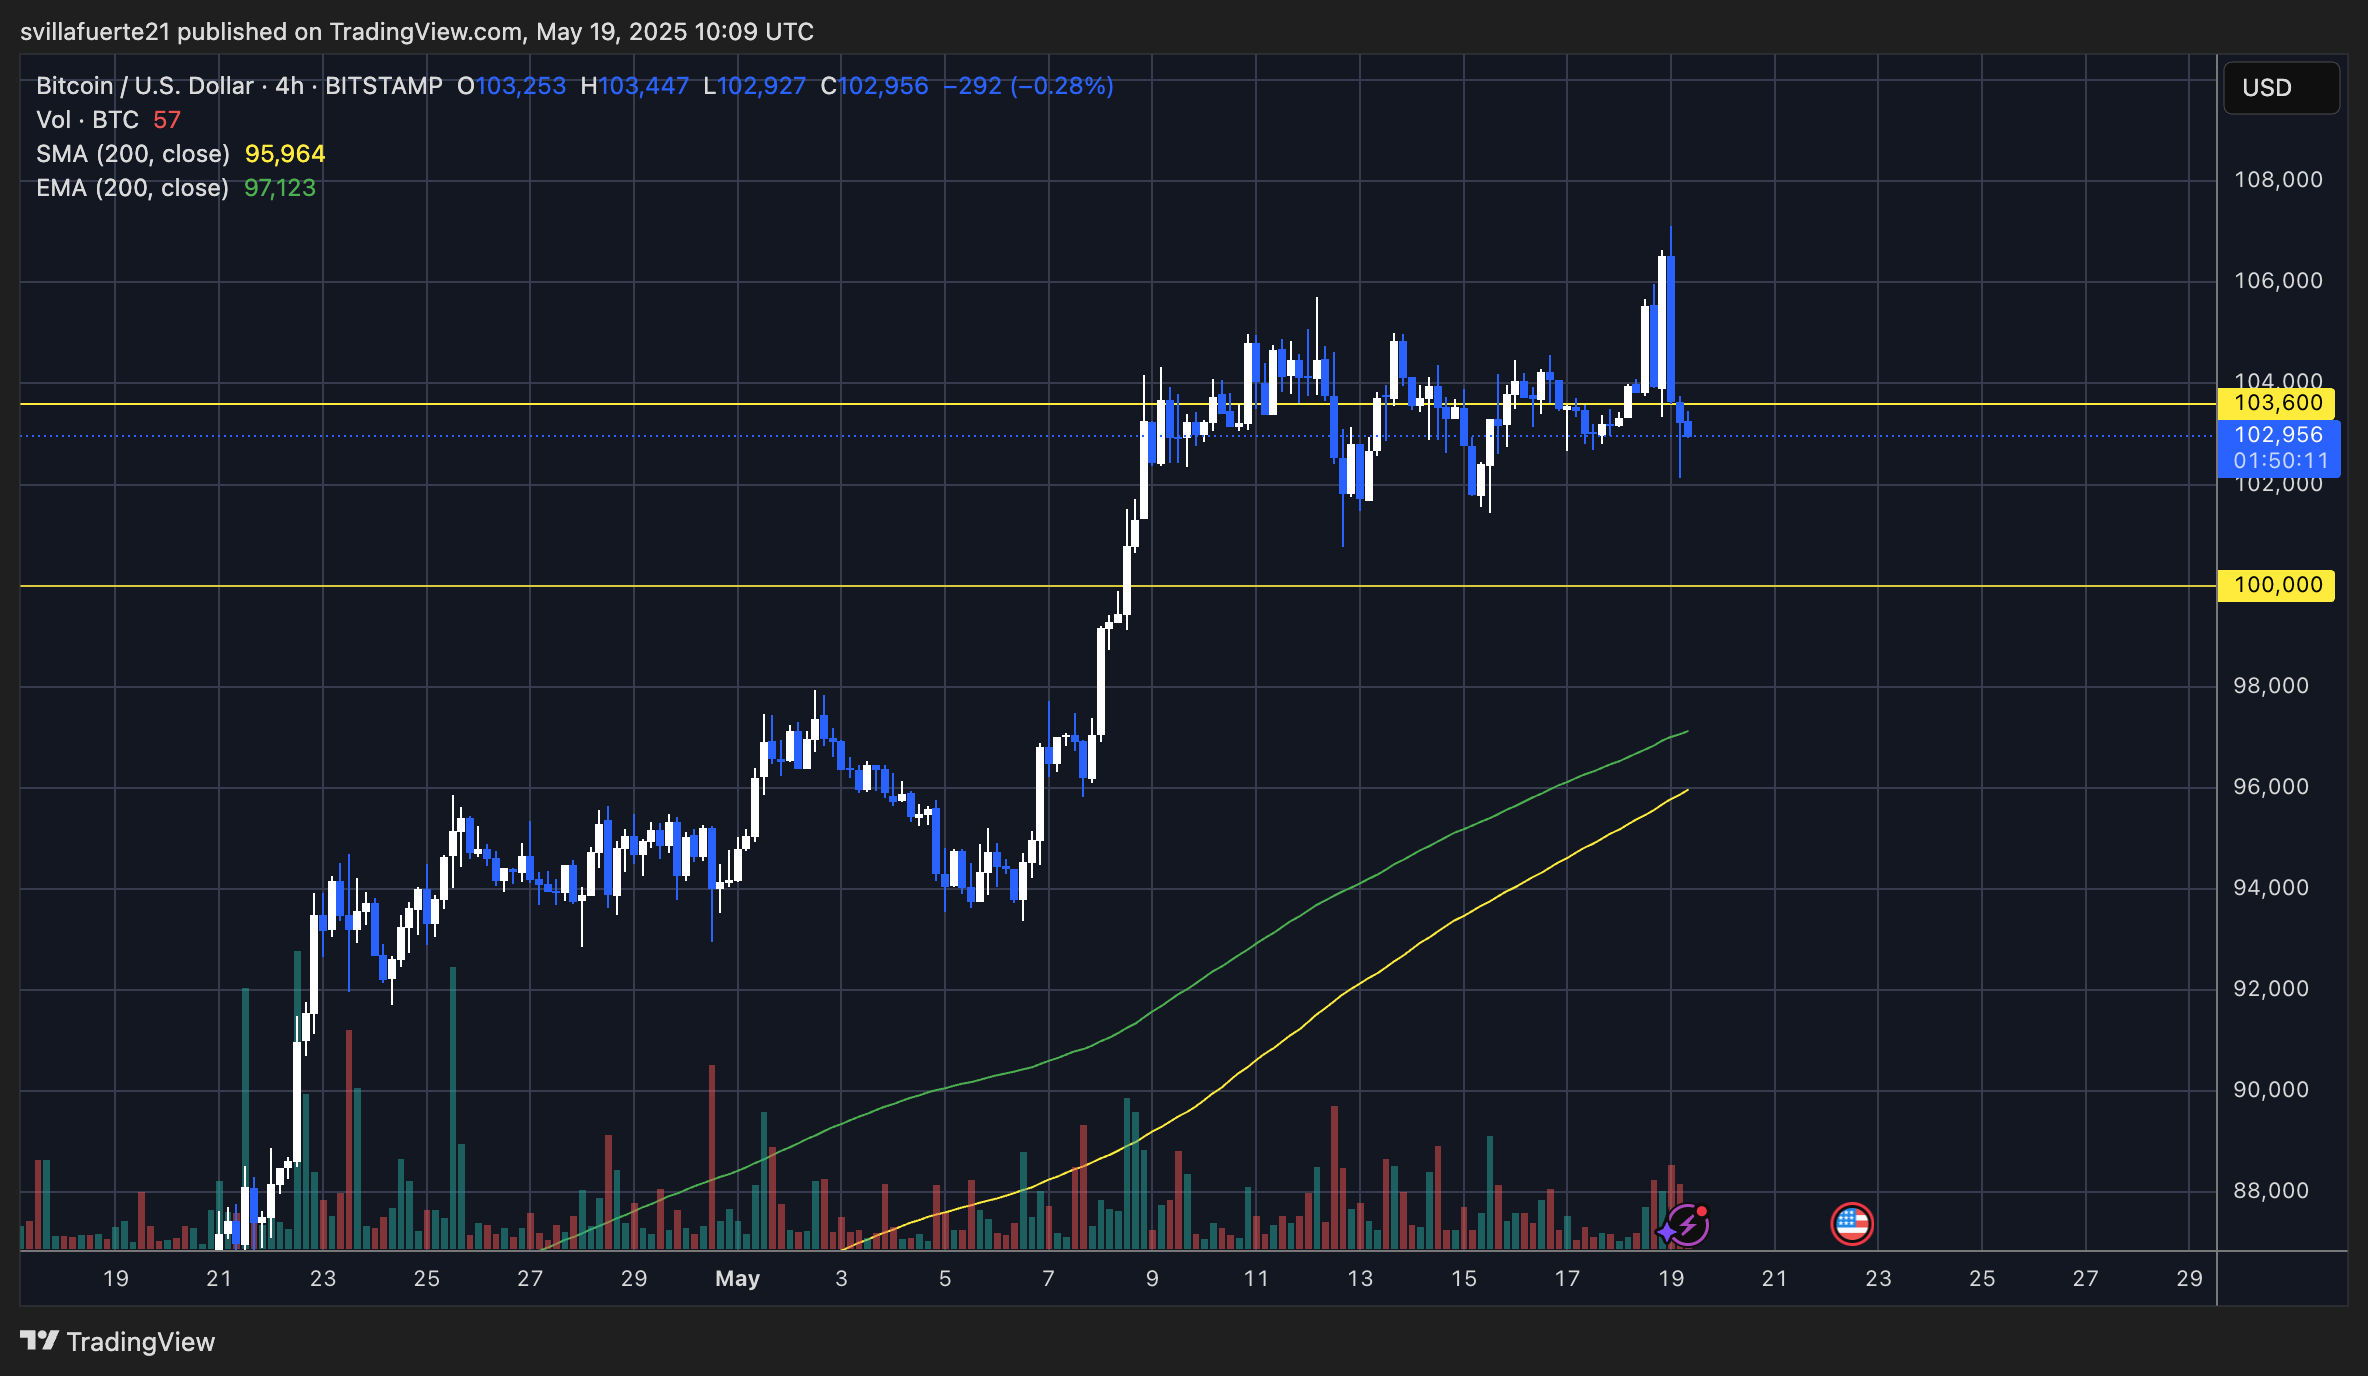
Despite the pullback, BTC remains above the 200-period EMA ($97,123) and SMA ($95,964), indicating that the broader trend is still intact for now. However, the failed breakout and subsequent bearish engulfing candle suggest momentum is weakening in the short term. If bulls fail to reclaim the $103,600 level quickly, the next significant support lies at $100,000 — a psychological and technical zone that must hold to prevent a shift in market structure.
Volume also spiked during the rejection, signaling strong selling interest at local highs. Until BTC reclaims higher ground, caution is warranted. A sustained drop below $100K could invalidate the current bullish setup, while a successful reclaim of $103.6K may open the door back to $107K and beyond. For now, the market watches to see if bulls can absorb the selling and stabilize the uptrend.
Featured image from Dall-E, chart from TradingView