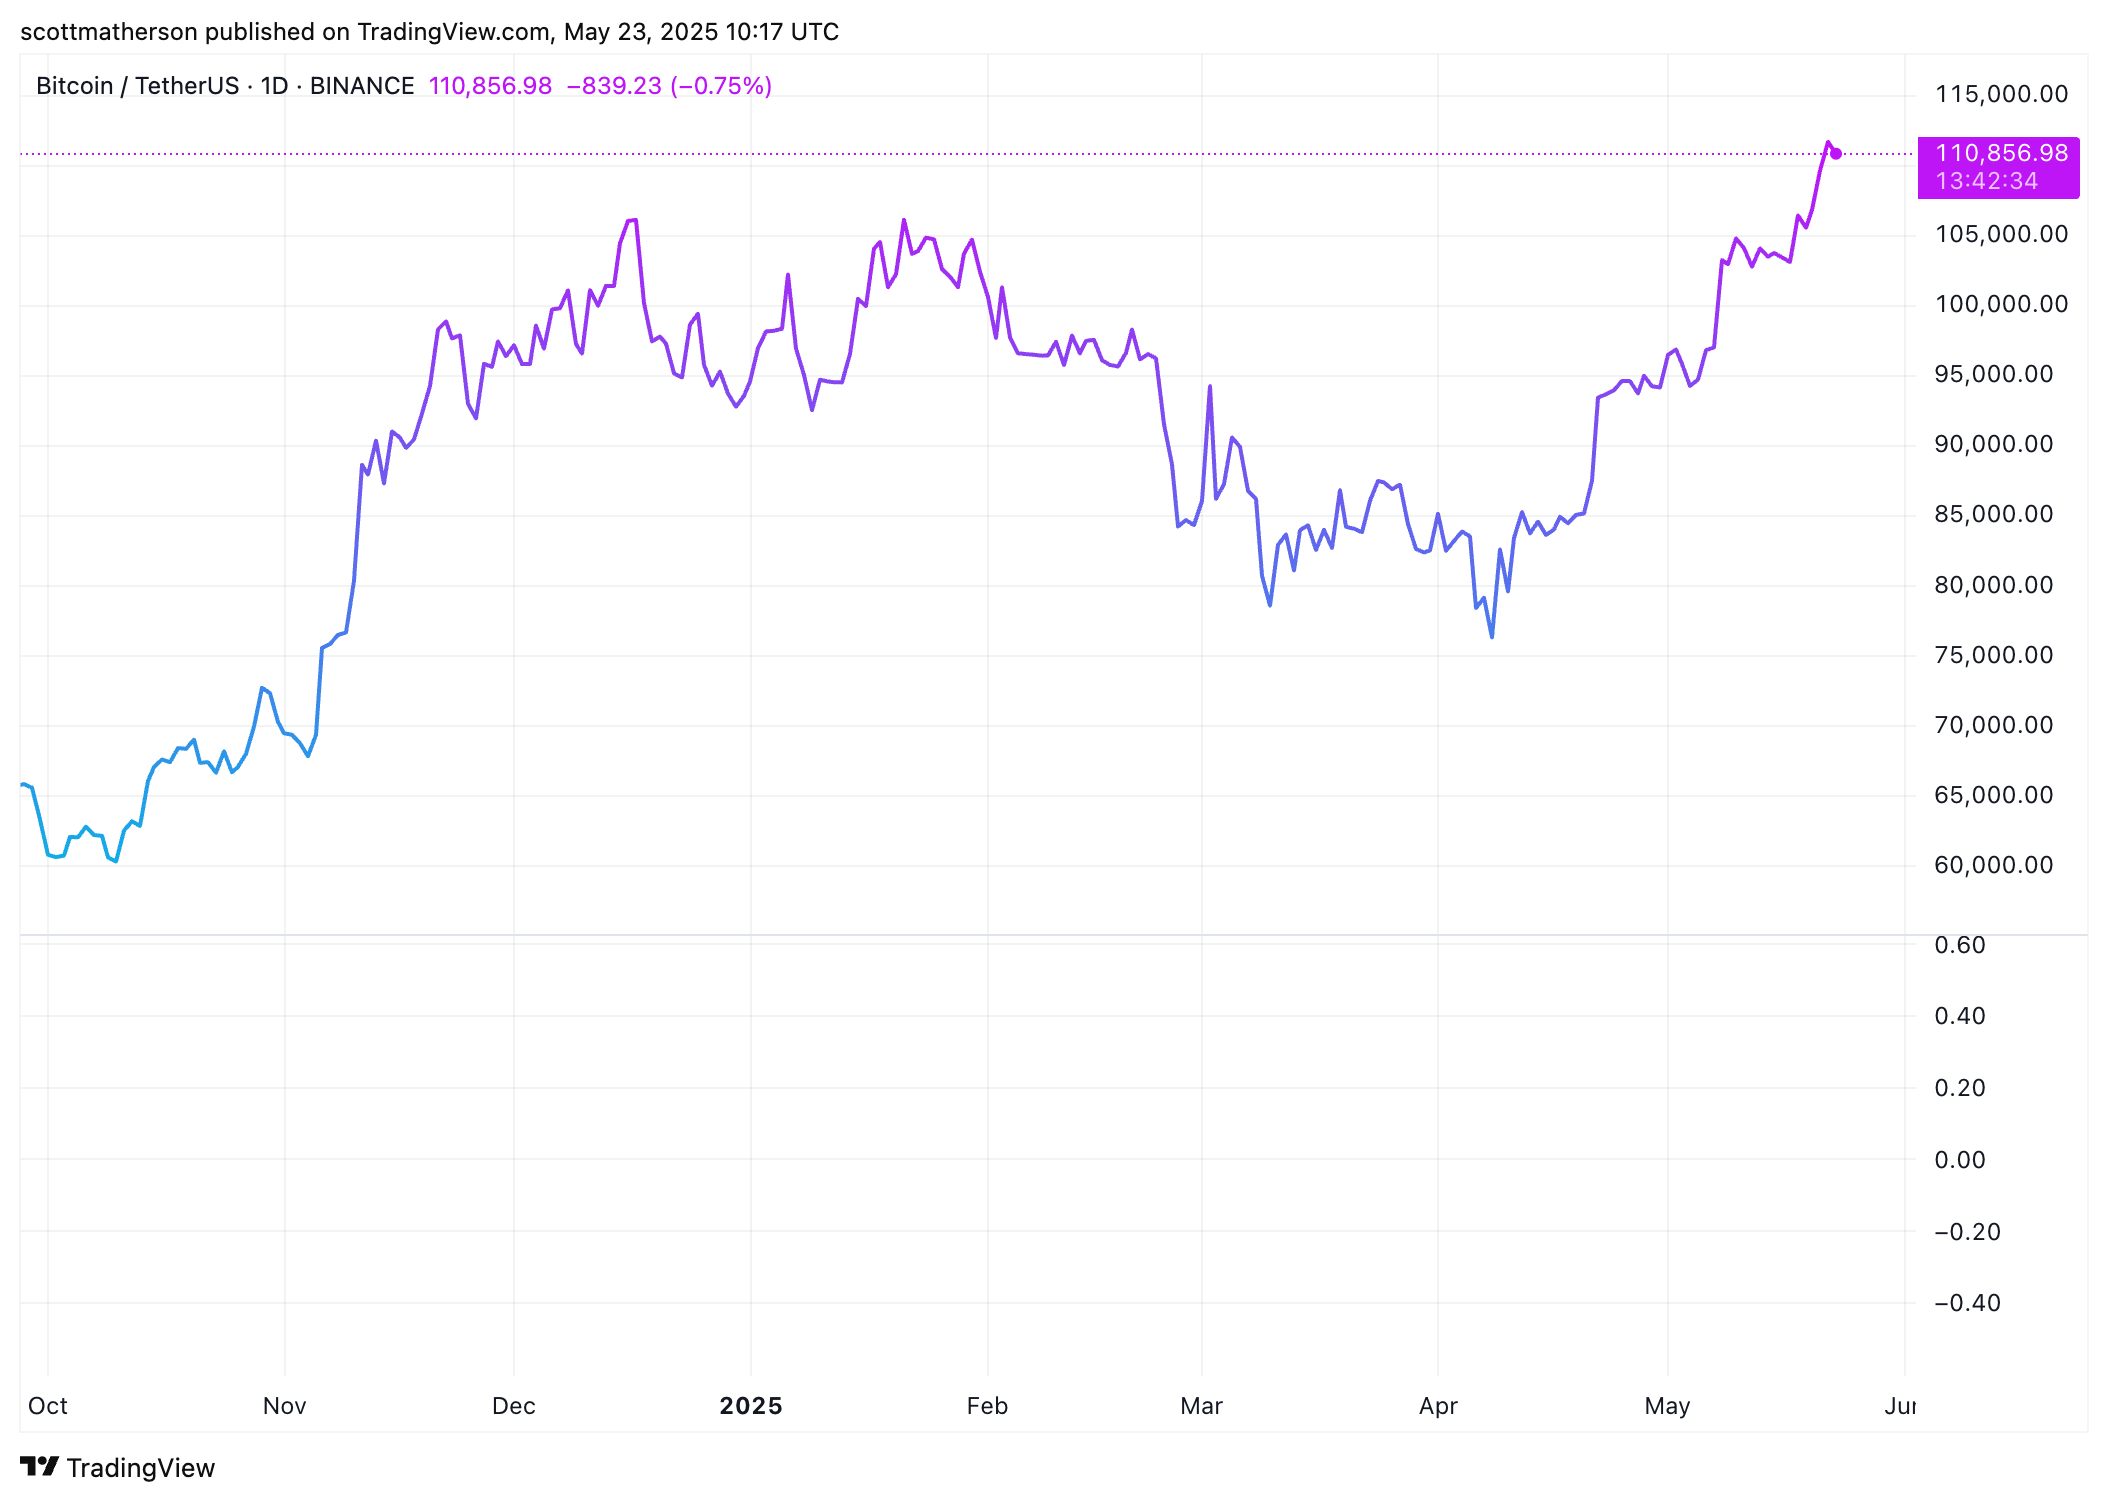
After several days of asking from bullish investors, Bitcoin has finally carved out a new all-time high above $108,800, reaching as high as $111,814 in the last 24 hours. The breakout to the new all-time high has been accompanied by strong buying volume, but the recent rally is now facing heavy friction from a concentrated zone of sell orders that appear to be keeping price action capped in a tight range. Bitcoin is currently consolidating just below $111,000 after retracing, and on-chain order book data from CoinGlass offers an explanation.
Chart Liquidity Heatmap Shows Strong Resistance Cluster
Data from CoinGlass reveals an aggressive concentration of sell orders between the $111,000 and $113,200 range. This is clearly visible in the heatmap chart below, where bright yellow bands represent heavy liquidity levels stacked above the current market price.
However, what is really interesting is what is happening at these liquidity levels. Sell orders are being layered at a rate of $8 million per $100 increment within these levels, forming a thick wall of resistance. Altogether, this zone carries approximately $200 million in cumulative sell-side pressure.
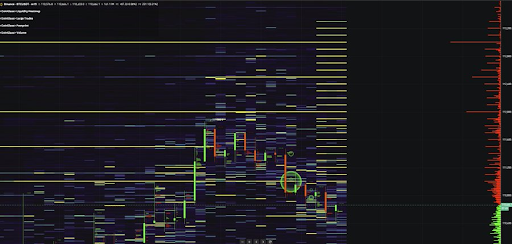
The visual data reflects consistent order flow resistance, with several candles wicking into the highlighted region only to retreat shortly after. In effect, the market could be entering a liquidity trap where bullish momentum is absorbed, and buyers at the top can get liquidated.
What The Massive $200 Million Sell Wall Means For Bitcoin Price
This large-scale sell wall typically represents institutional distribution or protective positioning from whales who anticipate a short-term correction. With Bitcoin having surged from below $106,000 to over $111,000 in such a short time, it’s unsurprising to see some profit-taking at these psychological thresholds.
However, the presence of this wall does not necessarily invalidate the broader bullish trend; it introduces a layer of friction that may result in consolidation or a temporary pullback. If Bitcoin is unable to break through this wall cleanly, there can be a prolonged sideways pattern as buy-side liquidity attempts to absorb the sell pressure. However, a sudden spike in spot demand or a liquidation cascade in short positions could trigger a breakout above $113,200, which would clear the path for price discovery beyond $115,000.
The Bitcoin Network Value to Transactions (NVT) Golden Cross seems to support this latter outlook. Technical analysis of Bitcoin’s price action using this indicator shows that the Bitcoin NVT golden cross is still out of the overbought zone, meaning that the price still has much room to run.
On the other hand, on-chain data shows an interesting trend from Bitcoin whales that can contribute to selling pressure. New whales, those currently holding huge amounts of BTC for less than 30 days, have started taking profit off of this new price peak. However, old whale addresses have contributed very little to selling pressure.
At the time of writing, Bitcoin is trading at $110,670.