
Bitcoin has officially entered uncharted territory after breaking above its previous all-time high of $109,000, climbing to a new peak of $112,000. The move comes after several days of tight consolidation and speculation, with bulls finally seizing control despite persistent macroeconomic headwinds. Global financial markets remain highly volatile, shaken by ongoing geopolitical tensions and increasing fears of a recession as US Treasury yields stay elevated.
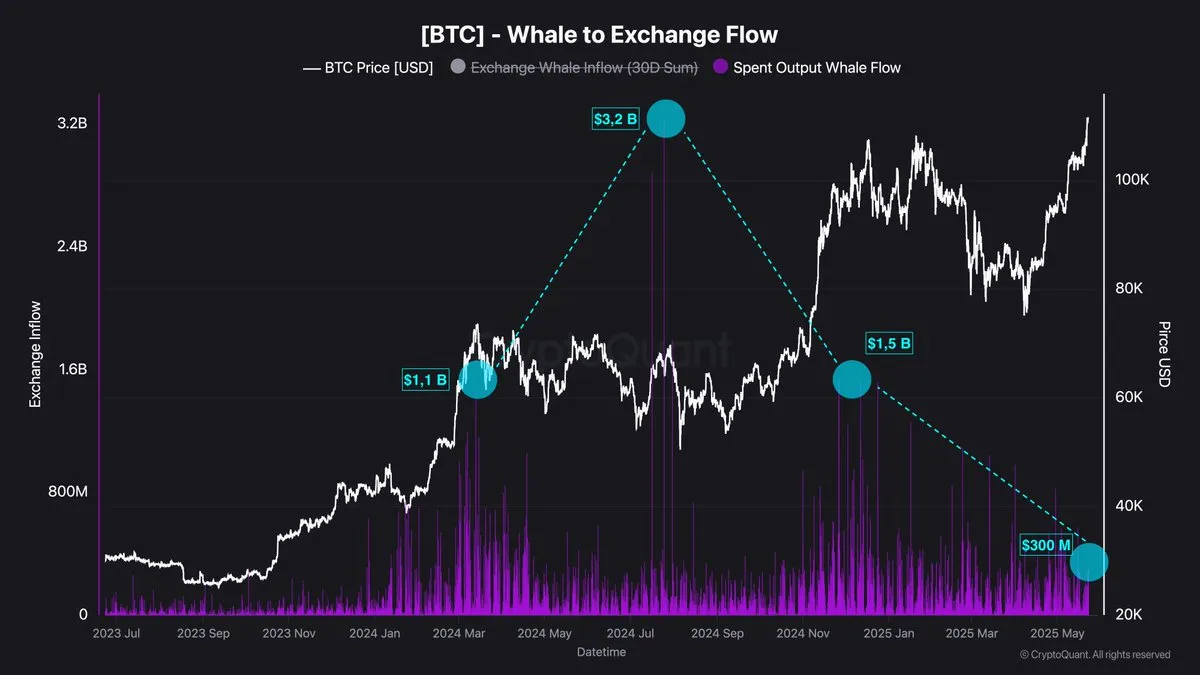
Interestingly, while prices surge, CryptoQuant data reveals a notable absence of aggressive whale selling. The Whale to Exchange Flow metric, which tracks the volume of large transfers from wallets to exchanges, shows that whales are not currently rushing to offload their holdings. Exchange inflows from large wallets remain well below levels typically seen near cycle tops.
The relatively muted whale activity suggests confidence in further upside potential, or at least a willingness to let the market push higher before realizing gains. With momentum building and supply staying tight, Bitcoin’s breakout could be the start of a much larger move—if support holds and market sentiment doesn’t shift.
Whale Behavior Signals Caution As Bitcoin Holds Bullish Structure
Bitcoin is currently trading just below the $110,000 mark, yet it continues to maintain a short-term bullish market structure. Despite the recent retracement from its new all-time high of $112,000, BTC has held above key support zones, which many analysts interpret as a sign of strength. Some expect continuation toward higher price levels, while others remain skeptical, warning of a potential breakdown below $100,000 if momentum fades or macro risks intensify.
Ongoing global tensions and financial uncertainty continue to shape market sentiment. Rising geopolitical risks and recession concerns have fueled volatility across traditional markets, but Bitcoin has shown resilience. Optimism surrounding a broader bullish phase continues to grow, especially as on-chain signals remain constructive.
Top analyst Darkfost provided important insights into whale behavior, a key variable during market tops. According to his analysis, whale activity remains “fairly neutral” despite BTC entering price discovery territory. The Whale to Exchange Flow metric confirms that volumes sent from large wallets to exchanges remain subdued, currently around $300 million per day. This is significantly lower than the $1 billion+ inflows observed during previous tops, such as in late 2021.
This restrained whale activity suggests that major holders are not rushing to sell, likely anticipating more upside before realizing profits. While short-term volatility is expected, the lack of heavy distribution hints at continued support for higher prices.
If Bitcoin can reclaim $110K and hold, the stage could be set for another leg higher, potentially drawing in sidelined capital and sparking further upside. Until then, all eyes remain on macro conditions, and the whales quietly hold their ground.
BTC Enters Price Discovery: Key Technical Levels
Bitcoin is holding firm above the key breakout zone around $103,600, even after facing selling pressure from its recent all-time high at $112,000. On the daily chart, BTC remains in a bullish structure, supported by a steep incline in the 34-day EMA (green), which continues to track closely below price. This shows strong trend continuation despite the brief retrace.
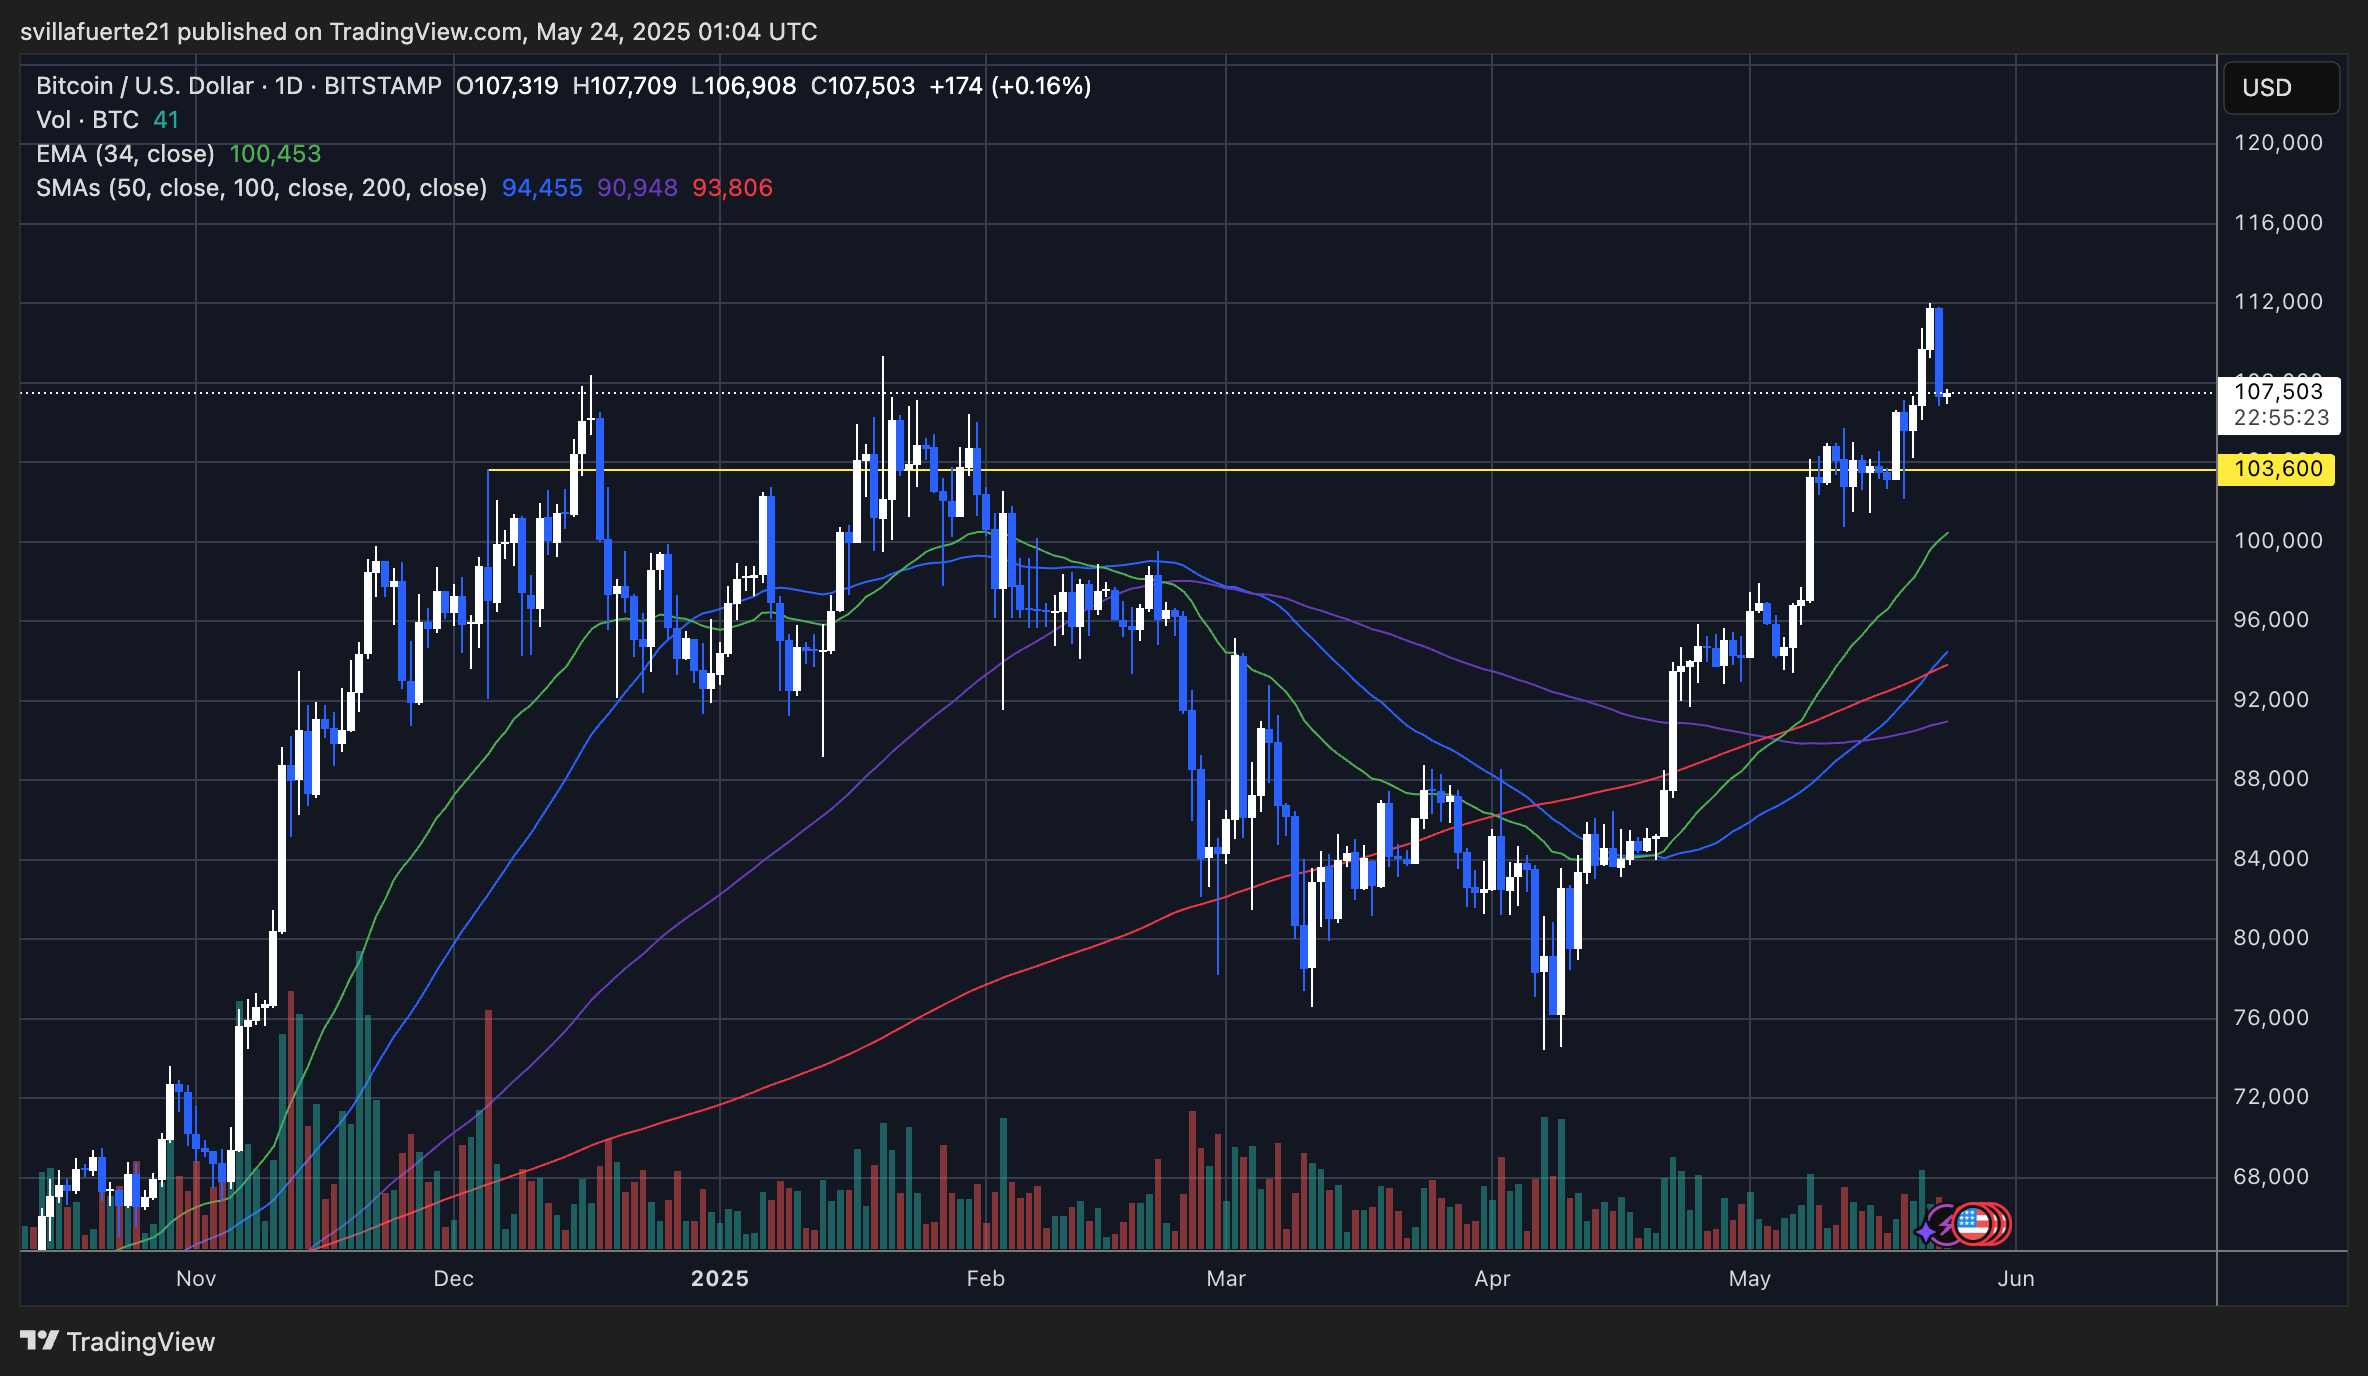
After breaking out of the long-standing horizontal resistance, BTC surged aggressively toward $112K before retracing to test the upper range of its former consolidation. The pullback appears healthy so far, with no major breakdown and volume tapering off—a typical sign of cooling rather than panic selling.
Momentum could resume if bulls defend the $103,600 support, which also aligns with the EMA cluster. A close above $110,000 would be a strong signal of resumed buying interest. Conversely, a daily close below $103,600 could suggest further downside toward the $100K psychological level and the rising 50-day moving average (currently near $94,455).
Featured image from Dall-E, chart from TradingView