Data shows the Bitcoin Taker Buy/Sell Ratio for Binance has diverged from the other exchanges recently. Here’s what this could suggest.
Bitcoin Taker Buy/Sell Ratio Has Spiked On Other Platforms, But Not On Binance
In a CryptoQuant Quicktake post, an analyst has discussed how the Taker Buy/Sell Ratio behavior on Binance has diverged from the rest of the sector recently. The “Taker Buy/Sell Ratio” refers to an indicator that tells us, as its name suggests, how the taker buy and taker sell volumes on a given exchange or group of exchanges compare.
When the value of this metric is greater than 1.0, it means more users on the platform are willing to buy tokens at a higher price. Such a trend implies that a bullish sentiment is dominant on the exchange. On the other hand, the indicator being under the threshold suggests the taker sell volume is outpacing the taker buy volume, and a bearish mentality is shared by the majority of the traders.
Now, here is a chart that shows the trend in the Bitcoin Taker Buy/Sell Ratio for all exchanges over the past couple of months:
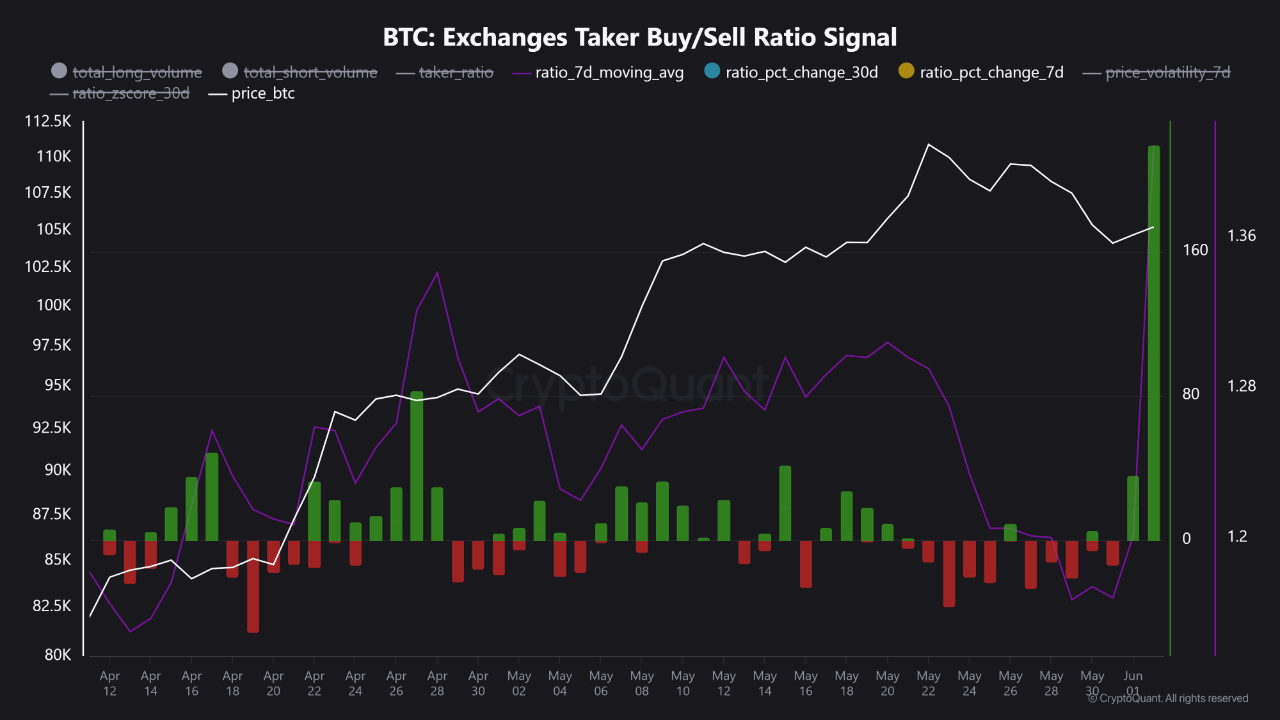
As displayed in the above graph, the 7-day average of the Bitcoin Taker Buy/Sell Ratio for all exchanges has recently witnessed a large spike and has gone well above the 1.0 level, indicating that the taker buy volume has sharply outpaced the taker sell volume.
Despite the bullish sentiment present in the market as a whole, however, users on the Binance exchange are showing a different behavior. Below is the chart for the Taker Buy/Sell Ratio specifically for this platform.
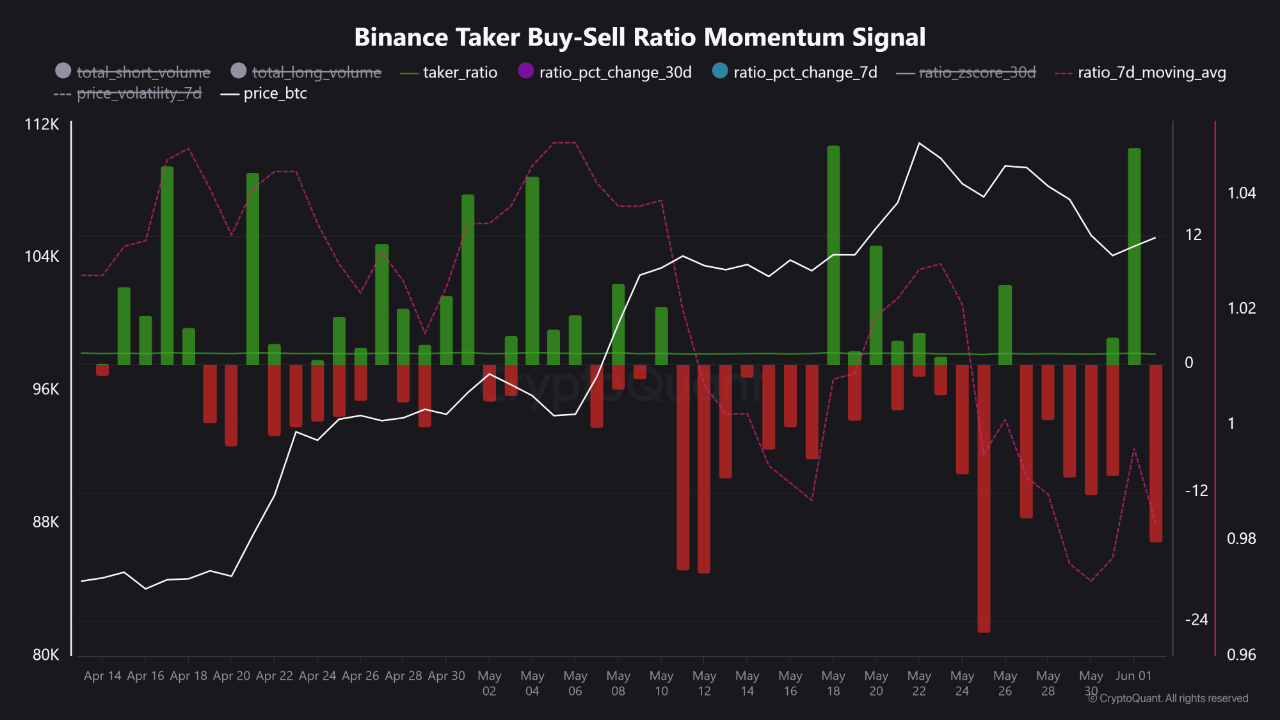
From the graph, it’s visible that the 7-day average of the Bitcoin Taker/Buy Sell Ratio has gone down on Binance recently and is currently under the 1.0 mark. Thus, it would seem like the investors on the exchange have been leaning toward a bearish sentiment instead.
“Binance routinely handles ~60 % of global BTC spot volume and the bulk of futures open interest, making its order book the primary arena for price discovery and large-block execution,” notes the quant. “When Binance taker flow leans to the sell side, it often overrides bullish prints elsewhere.”
The analyst has also pointed out that back in August 2023 and February 2024, a similar divergence also emerged in the market. Bitcoin dropped 5 to 10% within days after this pattern on both occasions.
It now remains to be seen whether this divergence would keep up in the coming days, potentially spelling a bearish outcome for BTC, or if the Taker Buy/Sell Ratio would see a turnaround on the platform and come in line with the rest of the market.
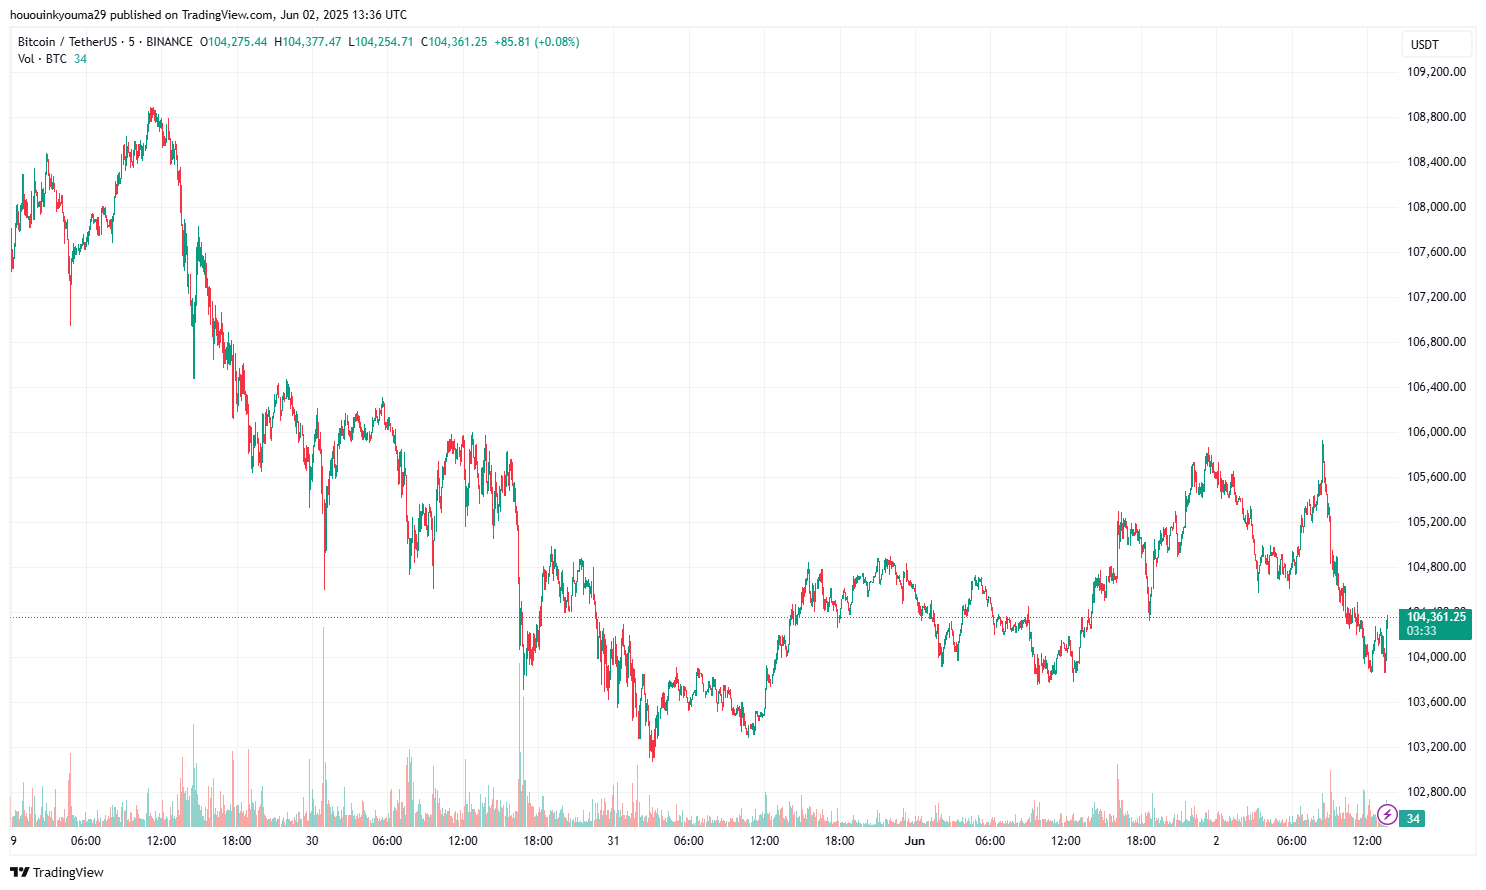
BTC Price
At the time of writing, Bitcoin is floating around $104,300, down more than 5% in the last seven days.