Data shows this narrow Bitcoin price range hosts a few key BTC lines, something that could make the range an important support cluster.
$94,000 To $97,900 Range Contains Different Bitcoin Price Models
In a new post on X, CryptoQuant author Axel Adler Jr has talked about where the nearest support cluster lies for Bitcoin. The range in question includes three key levels that have played the role of support in the past.
Two of the lines are moving averages (MAs) of the cryptocurrency’s price: 111-day and 200-day. An MA is a tool that calculates the average of an asset’s value and, as its name suggests, moves alongside it in time, changing its value accordingly.
MAs find their use in studying long-term trends, as they smooth out local fluctuations. They can be taken over any period, be that one minute or one millennium. In the context of the current topic, the relevant periods are 111 days and 200 days.
The third support line of interest is an on-chain metric: the Realized Price of the short-term holders. The Realized Price keeps track of the cost basis of the average investor or address on the Bitcoin network. Here, the version of the indicator that’s of focus is that specifically for the short-term holders.
The short-term holders (STHs) refer to the BTC investors who purchased their coins within the past 155 days. These holders make up for one of the two main divisions of the network done on the basis of holding time, with the other side being known as the long-term holders (LTHs).
When the STH Realized Price is trading below the spot price of the cryptocurrency, it means the recent buyers as a whole are holding a net unrealized profit. On the other hand, the metric being under the asset’s value suggests the cohort is underwater.
Now, here is the chart shared by the analyst that shows the trend in all three of the indicators over the last few years:

As displayed in the above graph, these levels are all packed into a narrow zone at the $94,000 to $97,900 range. Considering the historical interactions that Bitcoin has had with these lines, it’s possible that this tight region could prove to be an important support cushion.
This would only be, of course, if the coin declines enough to retest it in the near future. While its price has recently indeed been going down, it remains some distance above the range for now.
BTC Price
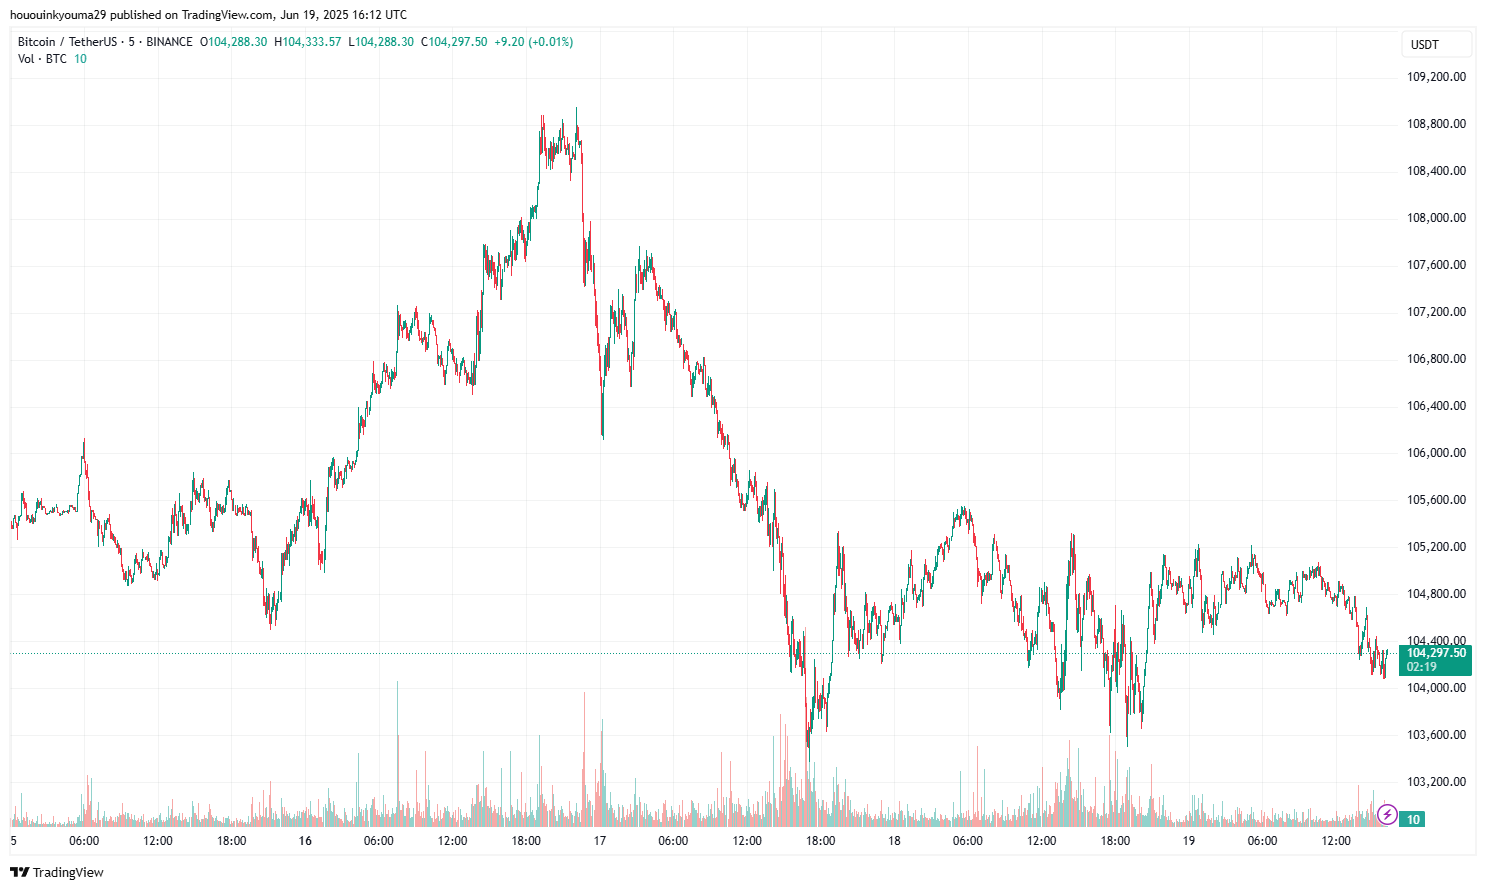
Since the high close to $109,000 at the start of the week, Bitcoin has come down to the $104,300 mark.