Bitcoin has climbed back toward the $110,000 mark, but Open Interest data could raise questions about the sustainability of the rally.
Bitcoin Has Seen A Reignition Of Bullish Momentum
Since falling into the low $105,000 levels on Tuesday, Bitcoin has seen some fresh momentum that has so far culminated in it reclaiming the $109,000 level and even making a brief retest of $110,000.
Below is a chart that shows how the recent trajectory of the coin has looked.
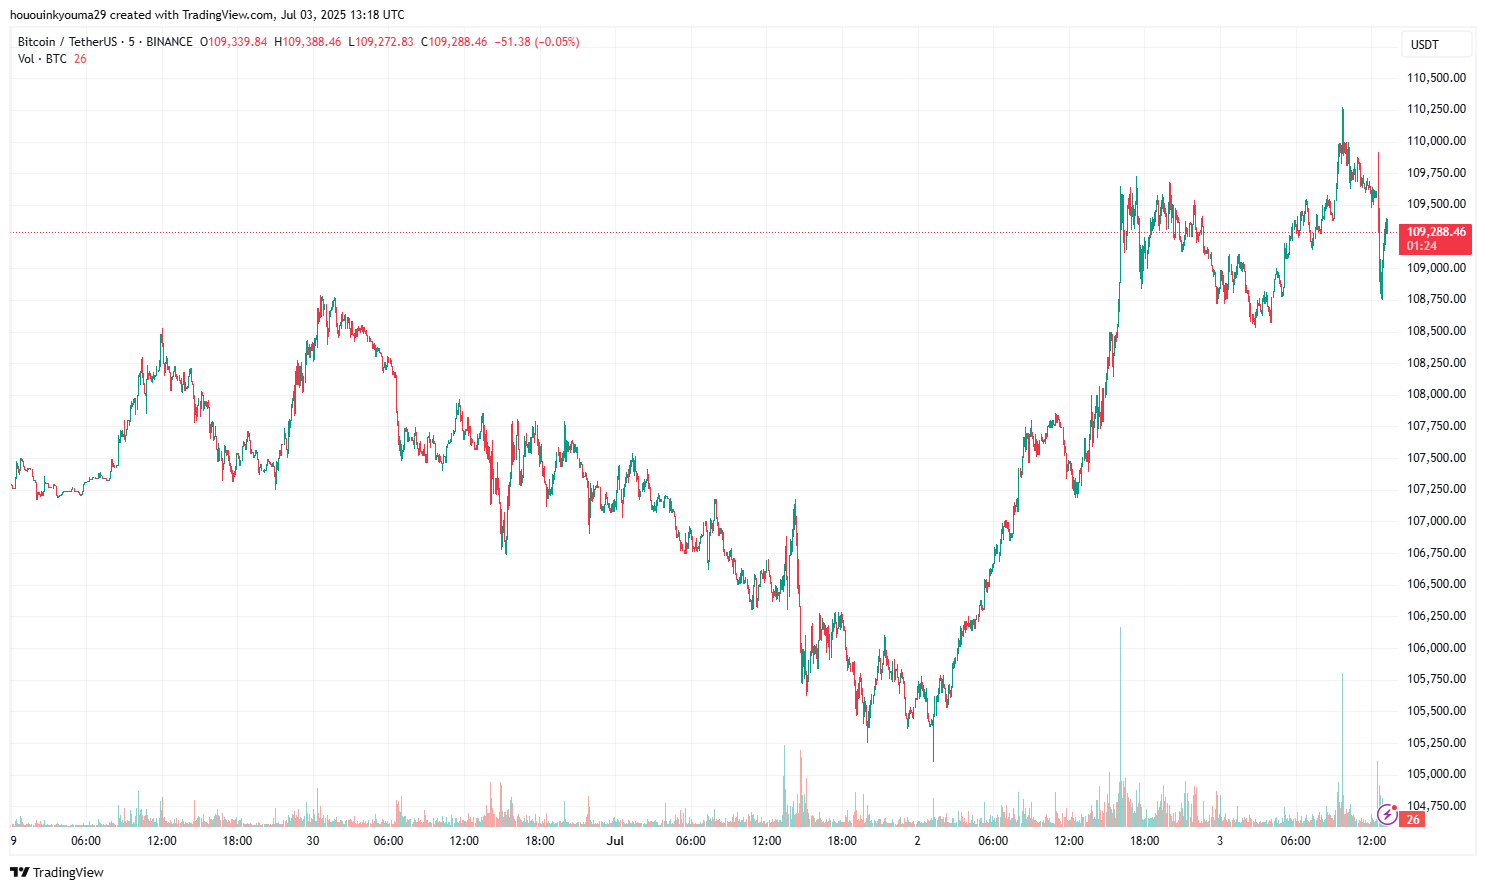
Over the last 24 hours, the asset has added around 2% to its recovery. This isn’t much, but the surge is still notable as it has brought the coin close to the all-time high (ATH). Now, will the rally sustain? The answer to that naturally relies on a number of factors, but one signal that could perhaps speak against it is the spike in the Open Interest.
BTC Open Interest Saw A Sharp Jump Alongside The Surge
As pointed out by CryptoQuant community analyst Maartunn in a new post on X, the latest BTC rally was accompanied by a rapid increase in the Open Interest. The “Open Interest” refers to a metric that keeps track of the total amount of Bitcoin-related positions that the derivatives market traders have currently active on the various centralized exchanges.
When the value of this metric rises, it means the investors are opening up fresh positions on the market. Generally, the total leverage present in the sector goes up when this trend appears, so the cryptocurrency’s price could become more volatile following it.
On the other hand, the indicator going down implies the holders are either closing up positions of their own volition or getting forcibly liquidated by their platform. Due to the flush of leverage, such a trend can lead to the asset behaving in a more stable manner.
Now, here is a chart that shows the trend in the 24-hour change of the Bitcoin Open Interest over the last month:
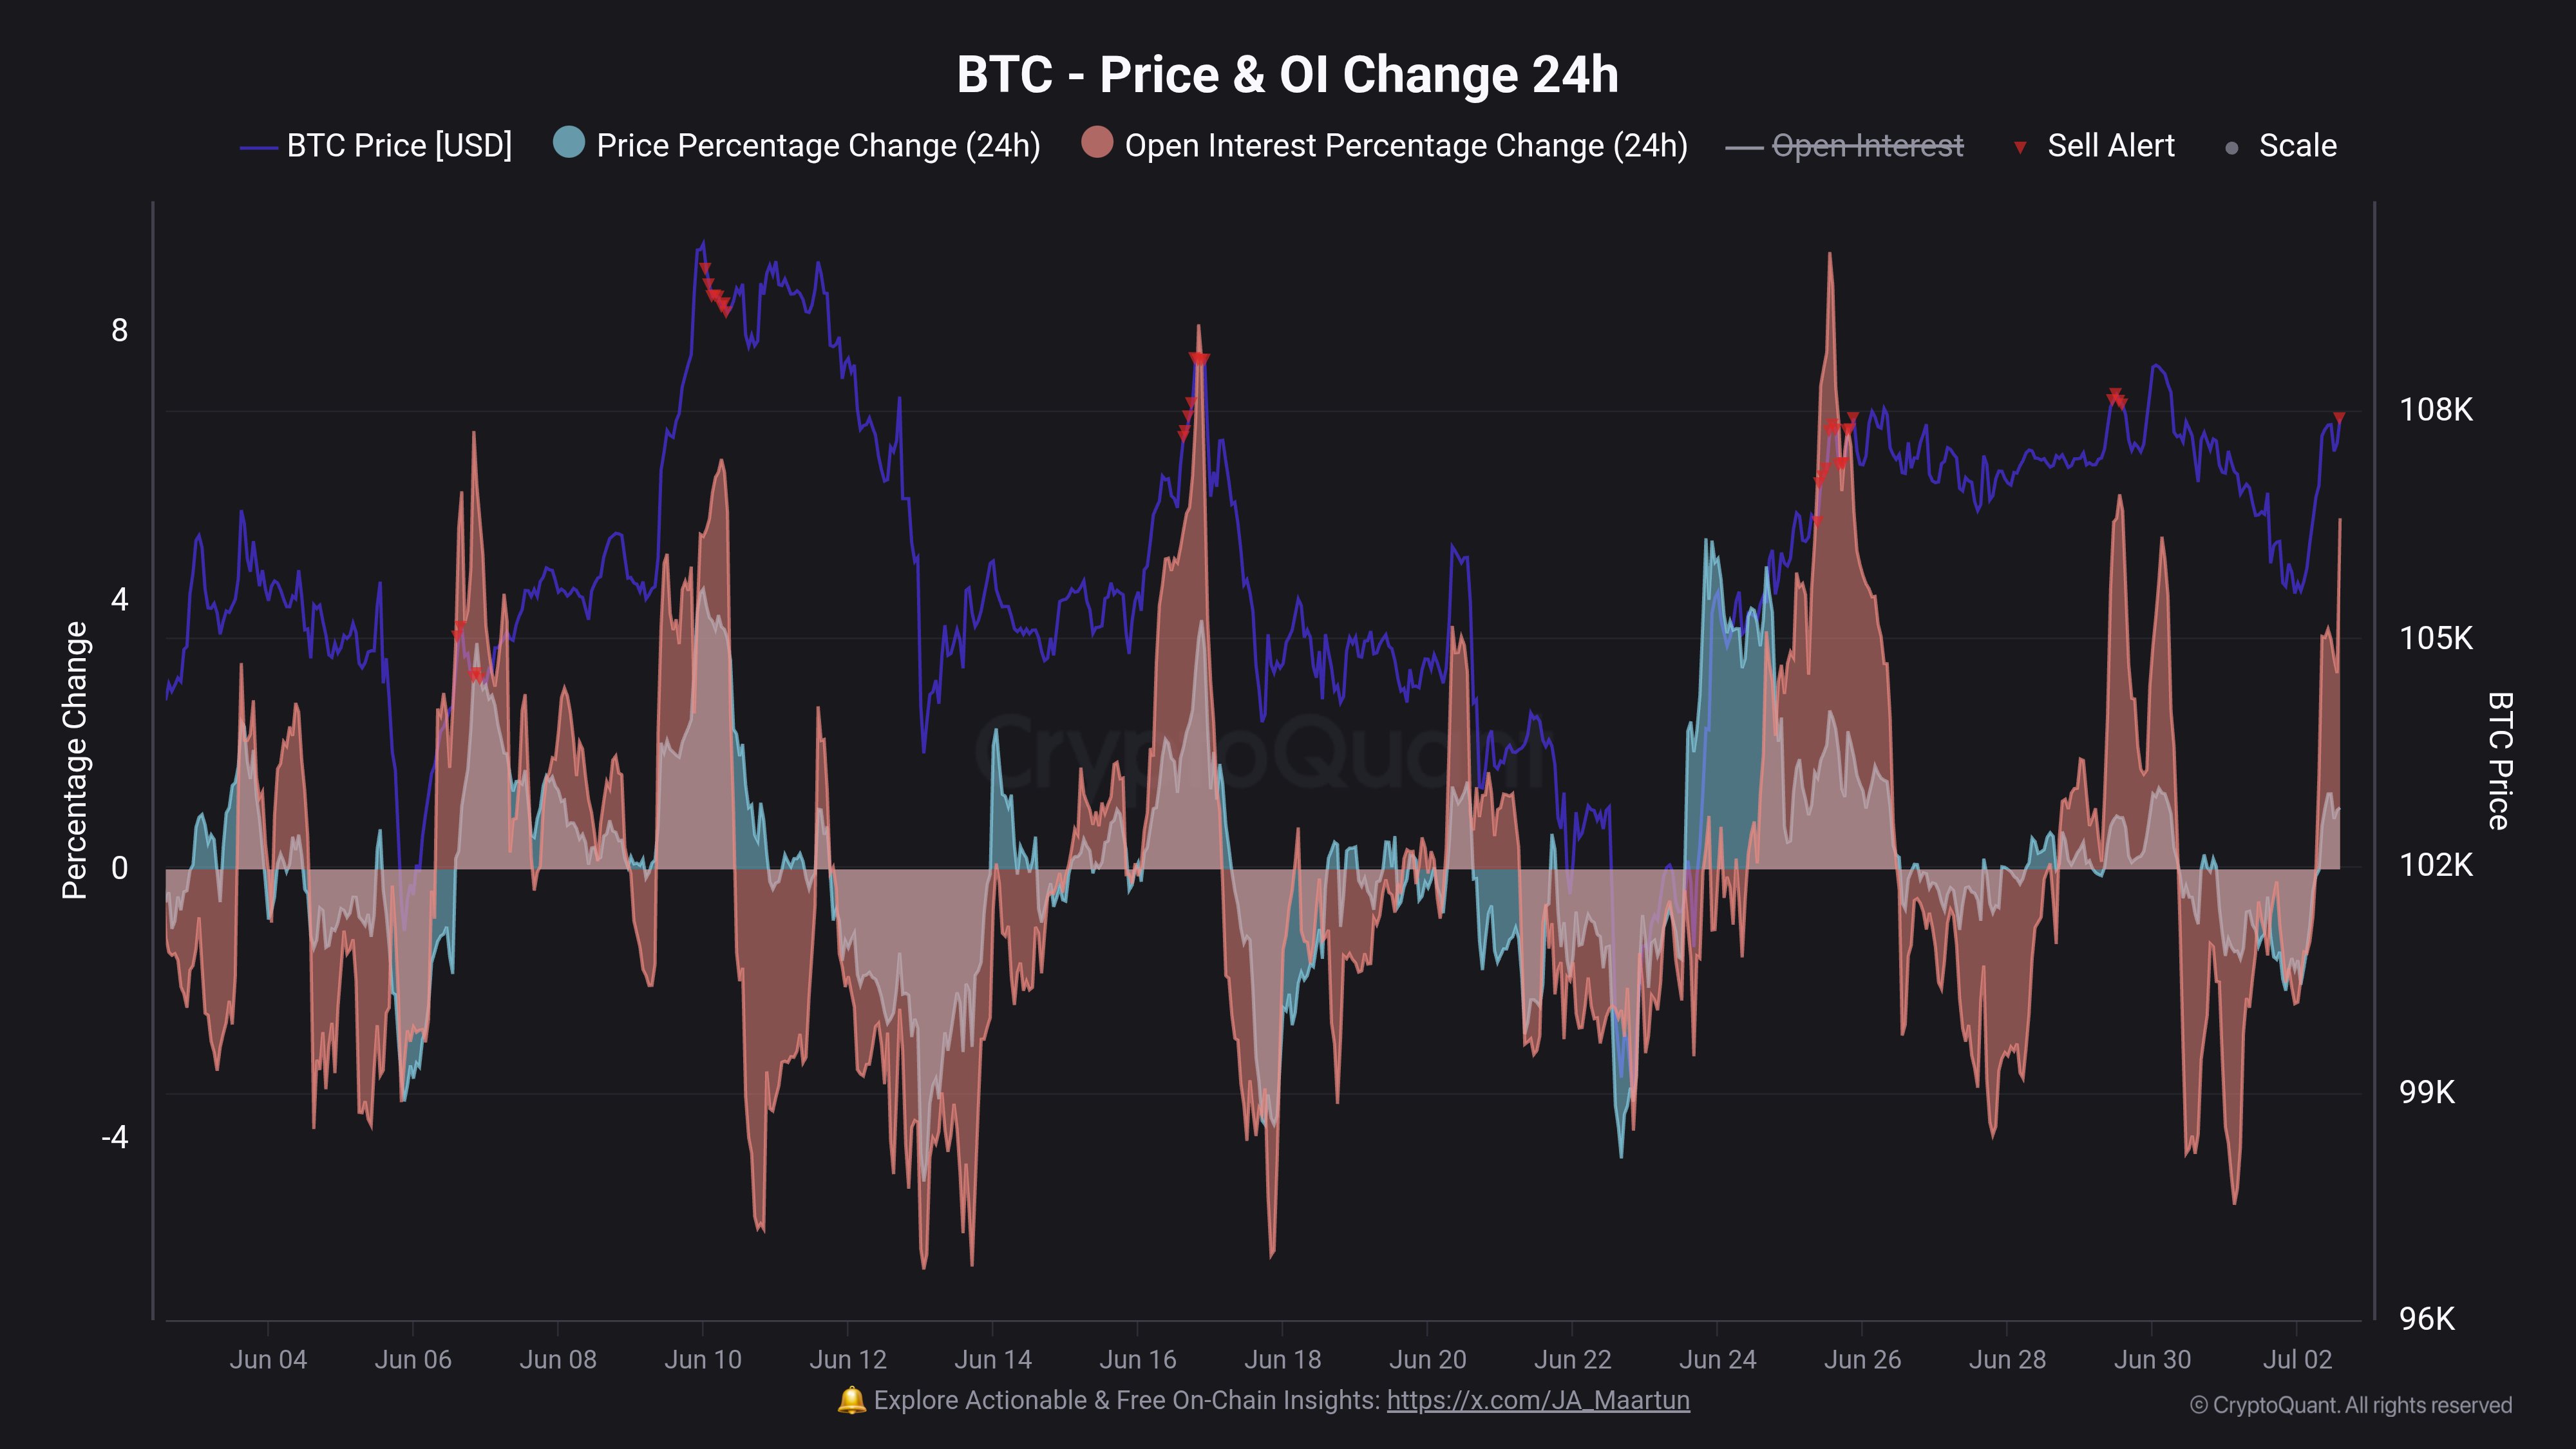
As is visible in the above graph, the 24-hour change in the Bitcoin Open Interest registered a sharp spike alongside the rally, indicating that investors opened up a large number of positions.
This isn’t anything unusual, as speculative activity tends to rise when significant price action occurs in the market. The scale of the spike, however, could be worth taking note of.
As the analyst has highlighted in the chart, the spikes of a similar order in the last month generally coincided with tops in the cryptocurrency’s price. It now remains to be seen whether the same pattern will play out this time as well.