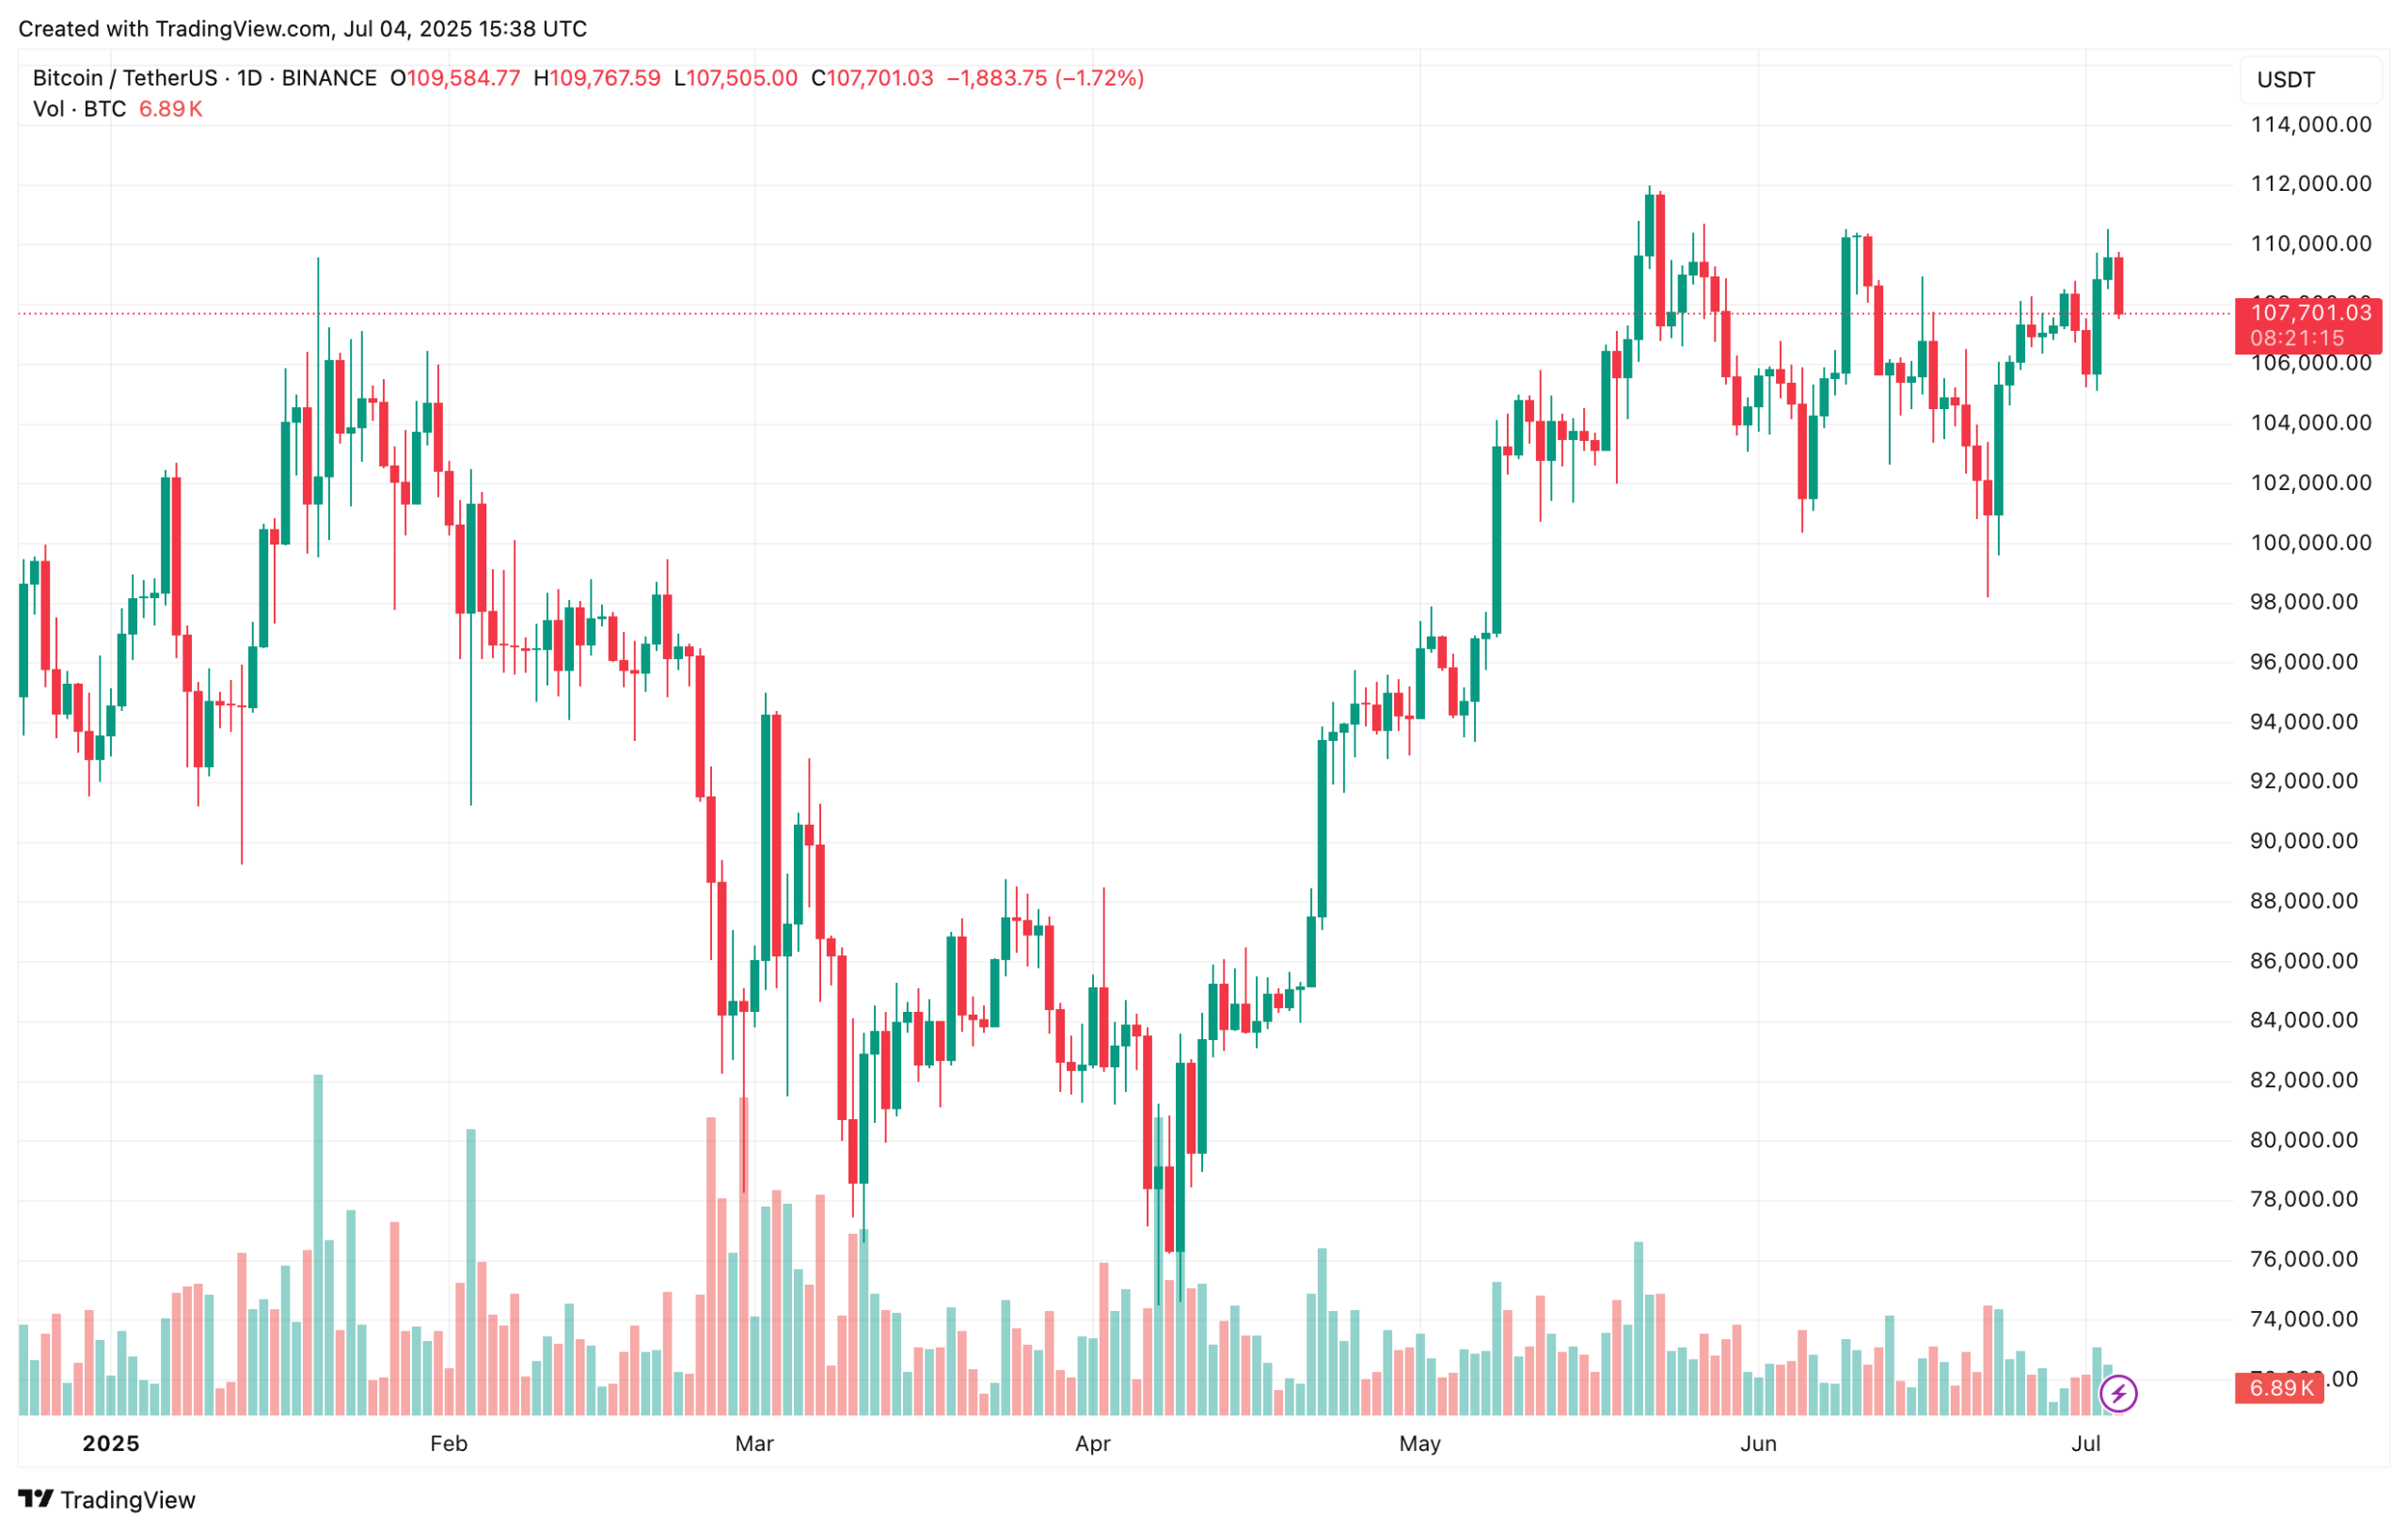
Although Bitcoin (BTC) has recorded slight losses over the past 24 hours – following strong US employment data – the top cryptocurrency’s overall structure remains overwhelmingly bullish, promising new highs in the near term.
Bitcoin Retests Bullish Megaphone Pattern
According to an X post by crypto analyst Mister Crypto, BTC recently completed a successful retest of a bullish megaphone pattern. The analyst shared the following chart, suggesting that BTC may finally be ready for a breakout to a new all-time high (ATH).
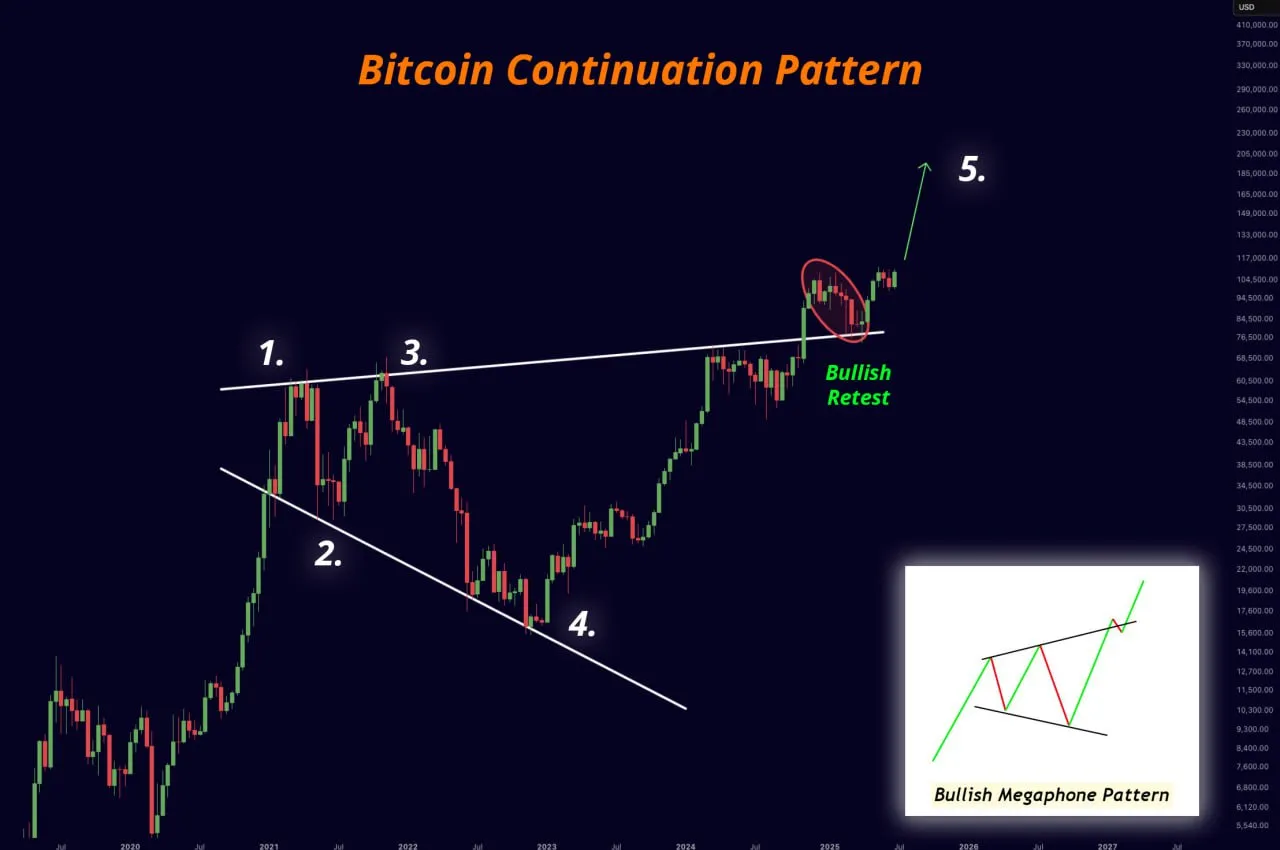
For the uninitiated, a bullish megaphone pattern occurs when price forms a broadening structure with higher highs and lower lows, followed by a breakout to the upside. It suggests growing volatility and buyer dominance, often leading to strong upward momentum once resistance is broken.
Similarly, fellow crypto analyst Jelle commented on the latest BTC price action, noting that while the digital asset is still trading in a local range, it has successfully flipped previous local highs into support levels.
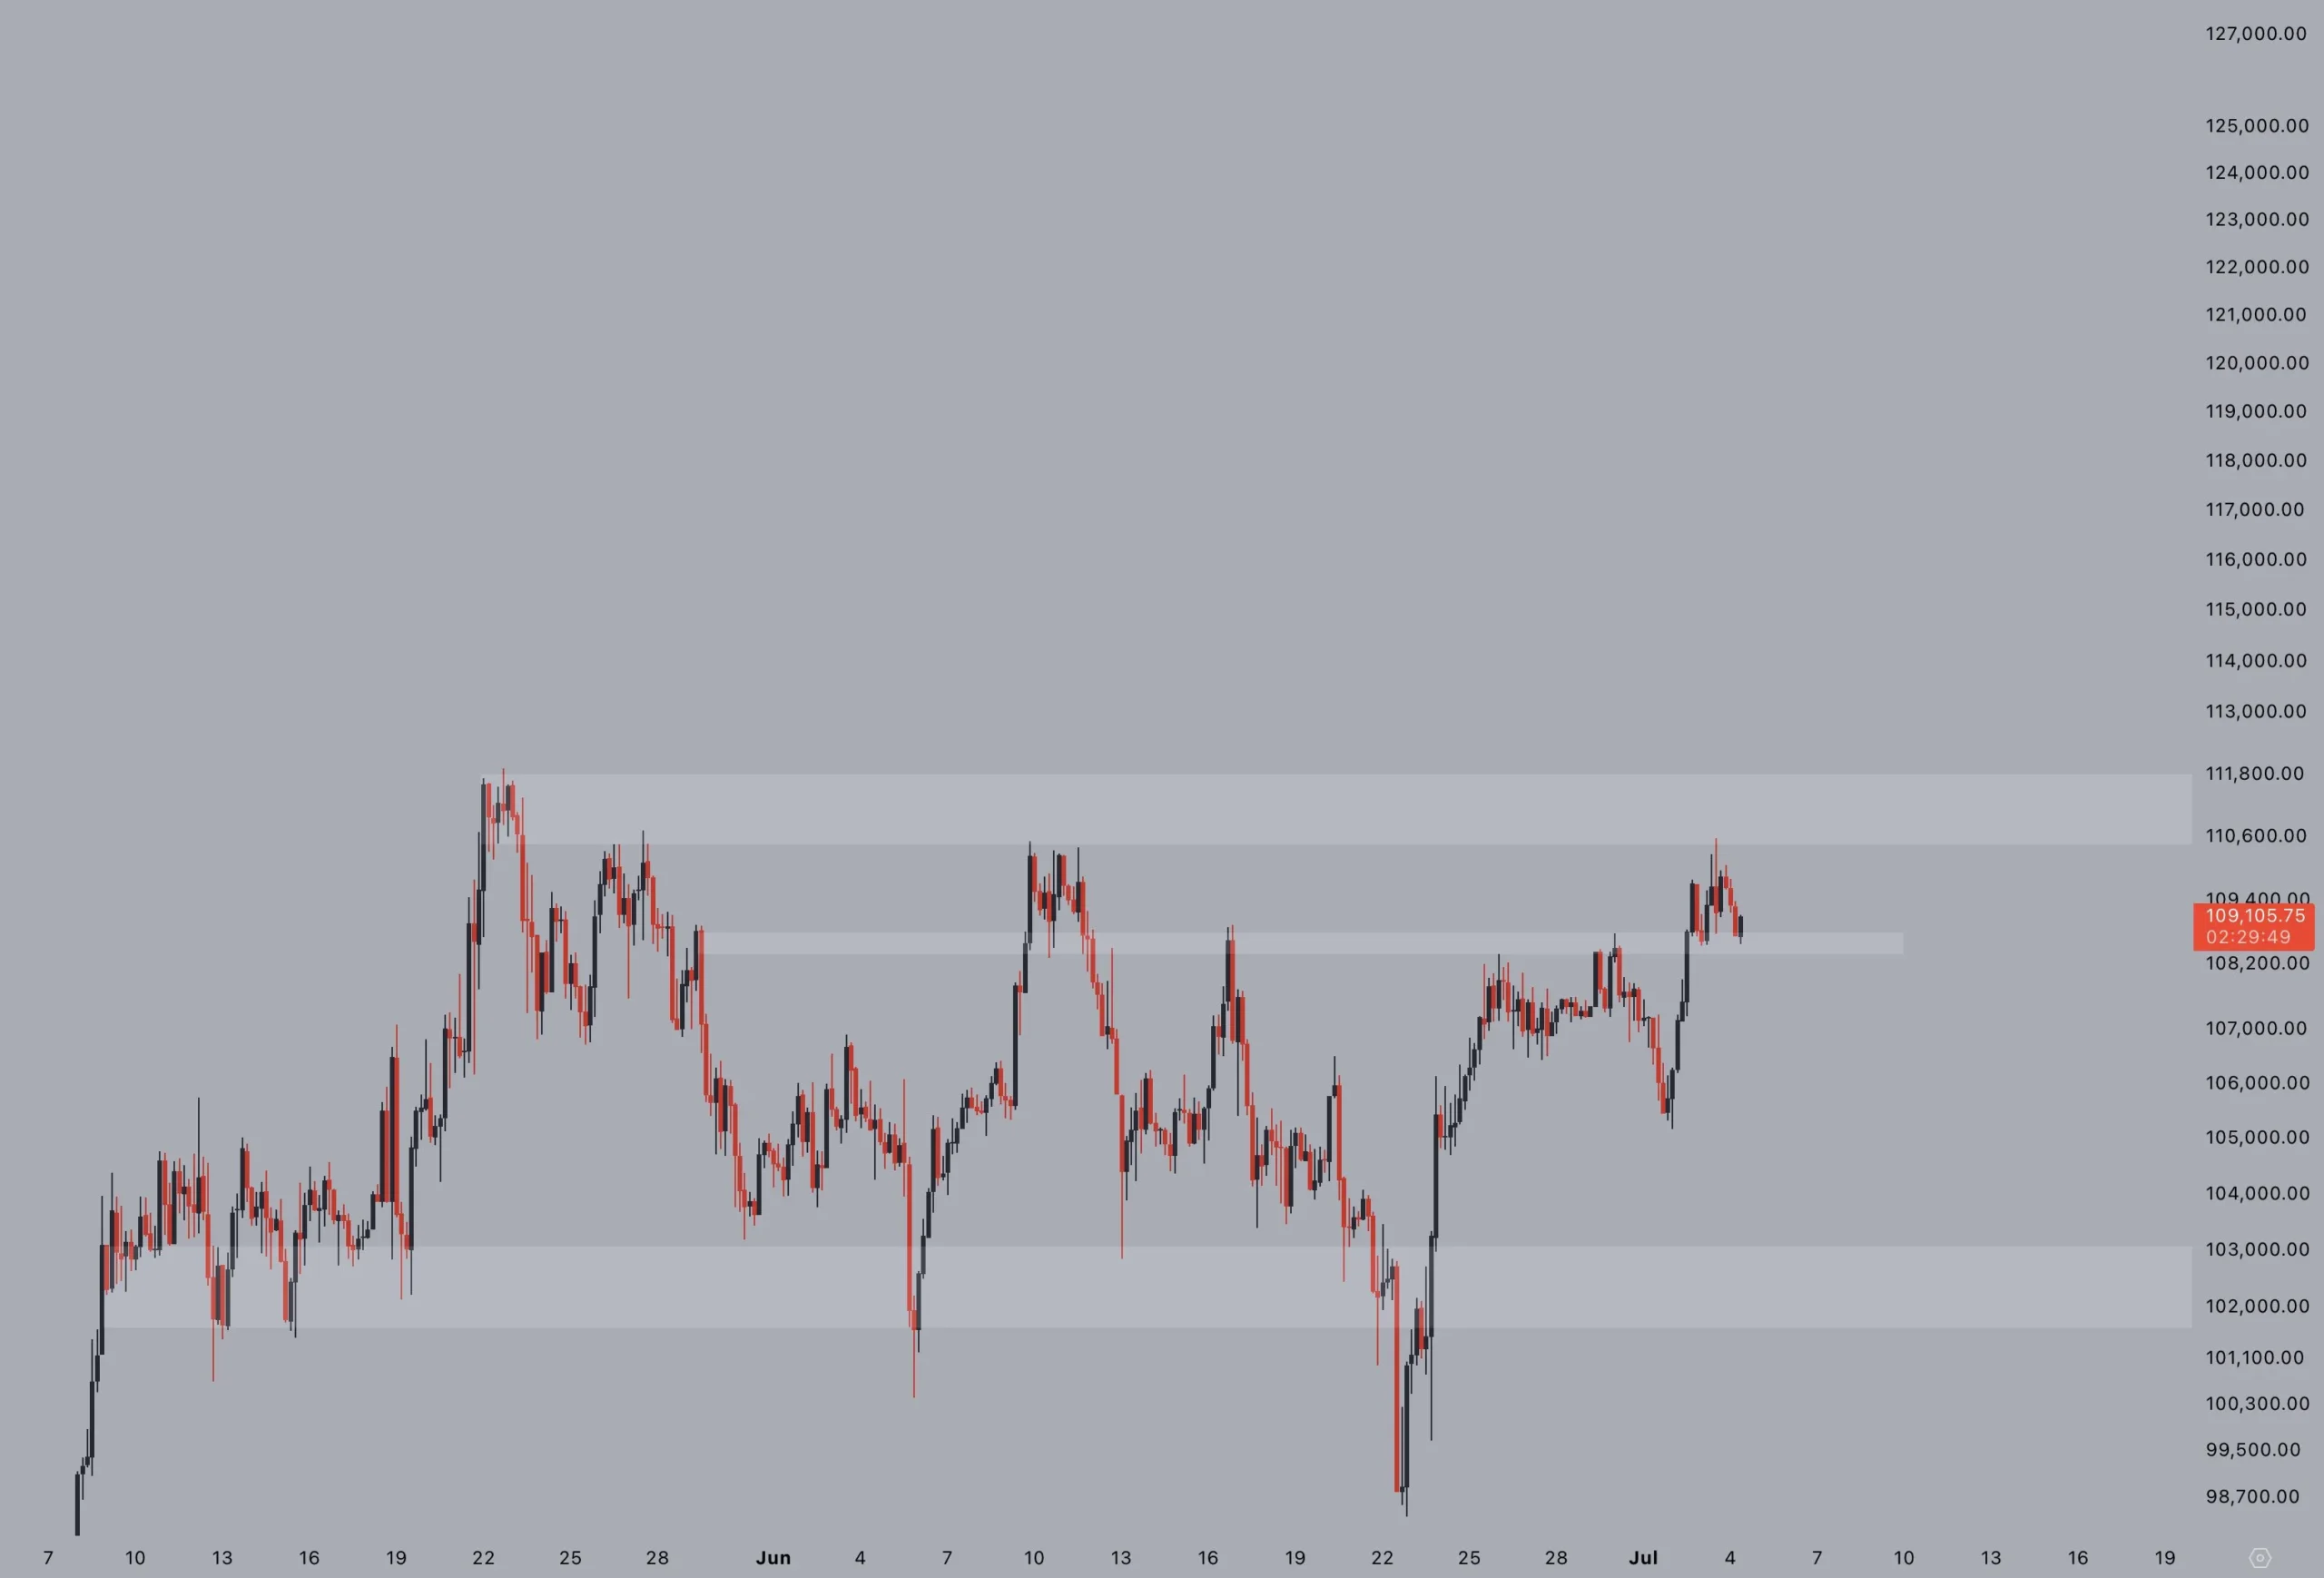
The analyst added that there’s just one more resistance level to overcome – $112,000. A decisive breakout above this level could propel BTC into what he called the “thin air” zone.
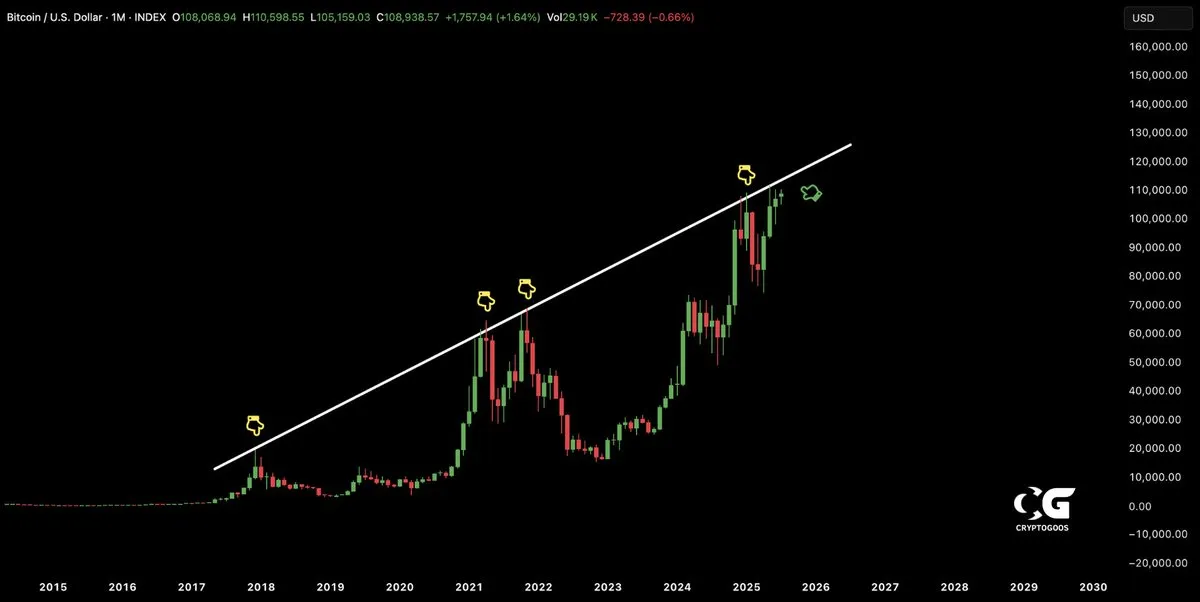
On a longer time frame, BTC appears to be steadily approaching a rising trendline formed by multiple previous resistance levels. Crypto analyst CryptoGoos noted that once Bitcoin breaks above this trendline, “sky is the limit.”
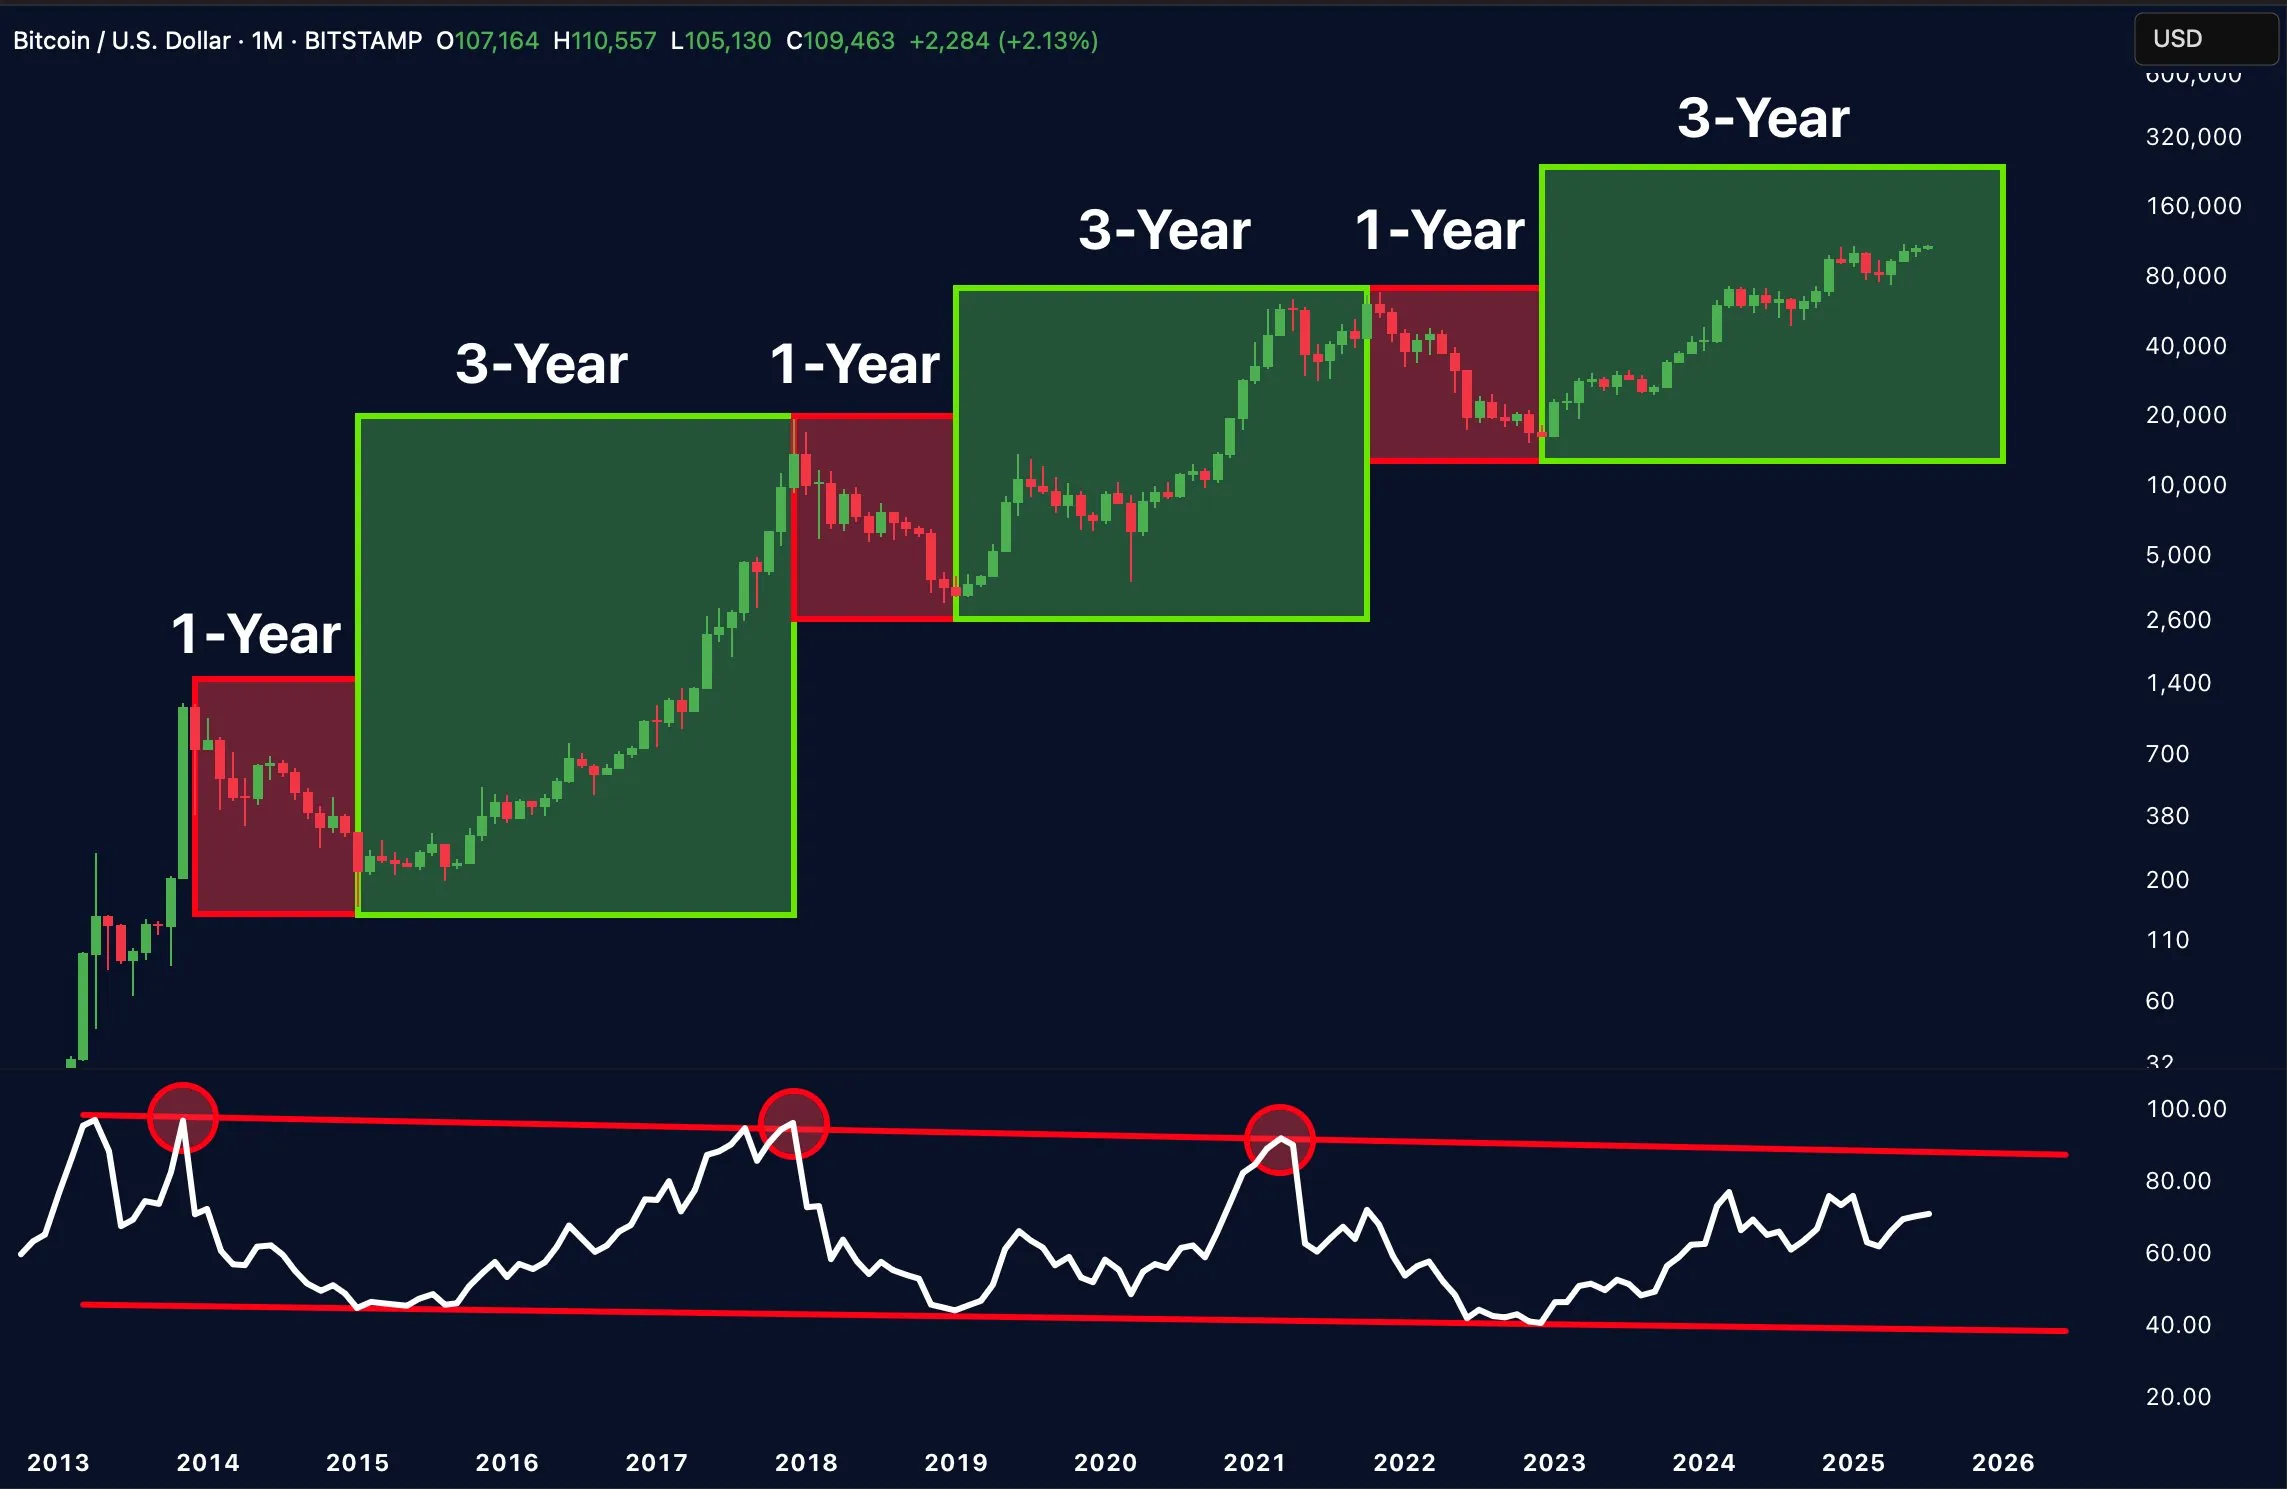
Zooming out further, crypto trader Merlijn the Trader highlighted Bitcoin’s three-year uptrend. He believes the final phase of this uptrend has begun, potentially taking BTC to $240,000 in the coming months.
BTC To Benefit From Short Squeeze?
Bitcoin may also benefit from short liquidations. In a separate X post, seasoned crypto analyst Ali Martinez noted that over $30 million in short positions could be wiped out if BTC surges past $111,000.
Short liquidations occur when traders who bet against an asset are forced to close their positions due to rising prices, typically by buying back the asset at a loss. This buying pressure can further drive prices up, often resulting in a rapid price surge known as a short squeeze.
Meanwhile, there are no clear signs of exhaustion in the Bitcoin market. According to a recent analysis by CryptoQuant contributor Crypto Dan, the BTC bubble chart suggests that the asset is cooling off without overheating – implying more room for growth.
That said, some risks remain. Bitcoin recently flashed a rare signal on the three-month chart that could foreshadow a brutal sell-off, possibly dragging the price down to $40,000. At press time, BTC trades at $107,701, down 1.6% in the past 24 hours.