Ethereum is currently exhibiting bearish behavior, highlighted by a divergence between price action and the RSI indicator. The market appears to be in a consolidation phase, with a decisive breakout likely to determine the next significant move.
Technical Analysis
By ShayanMarkets
The Daily Chart
ETH remains stuck in a consolidation phase, trading just beneath the critical $2.8K resistance zone and the 200-day moving average. The price action within this area has lacked upward strength, with the market gradually forming an ascending flag pattern. The range is clearly defined by resistance at $2.8K and support near the $2.4K demand zone.
A clear bearish divergence has developed between the price and the RSI, signaling weakening bullish momentum and a growing presence of sellers. This divergence suggests that the current rally may be losing steam, potentially leading to a deeper correction.
Ethereum has already lost support at the 200-day MA and is now on track to retest the lower boundary of the flag near $2.4K. A decisive breakout from this structure is likely to shape the next major move.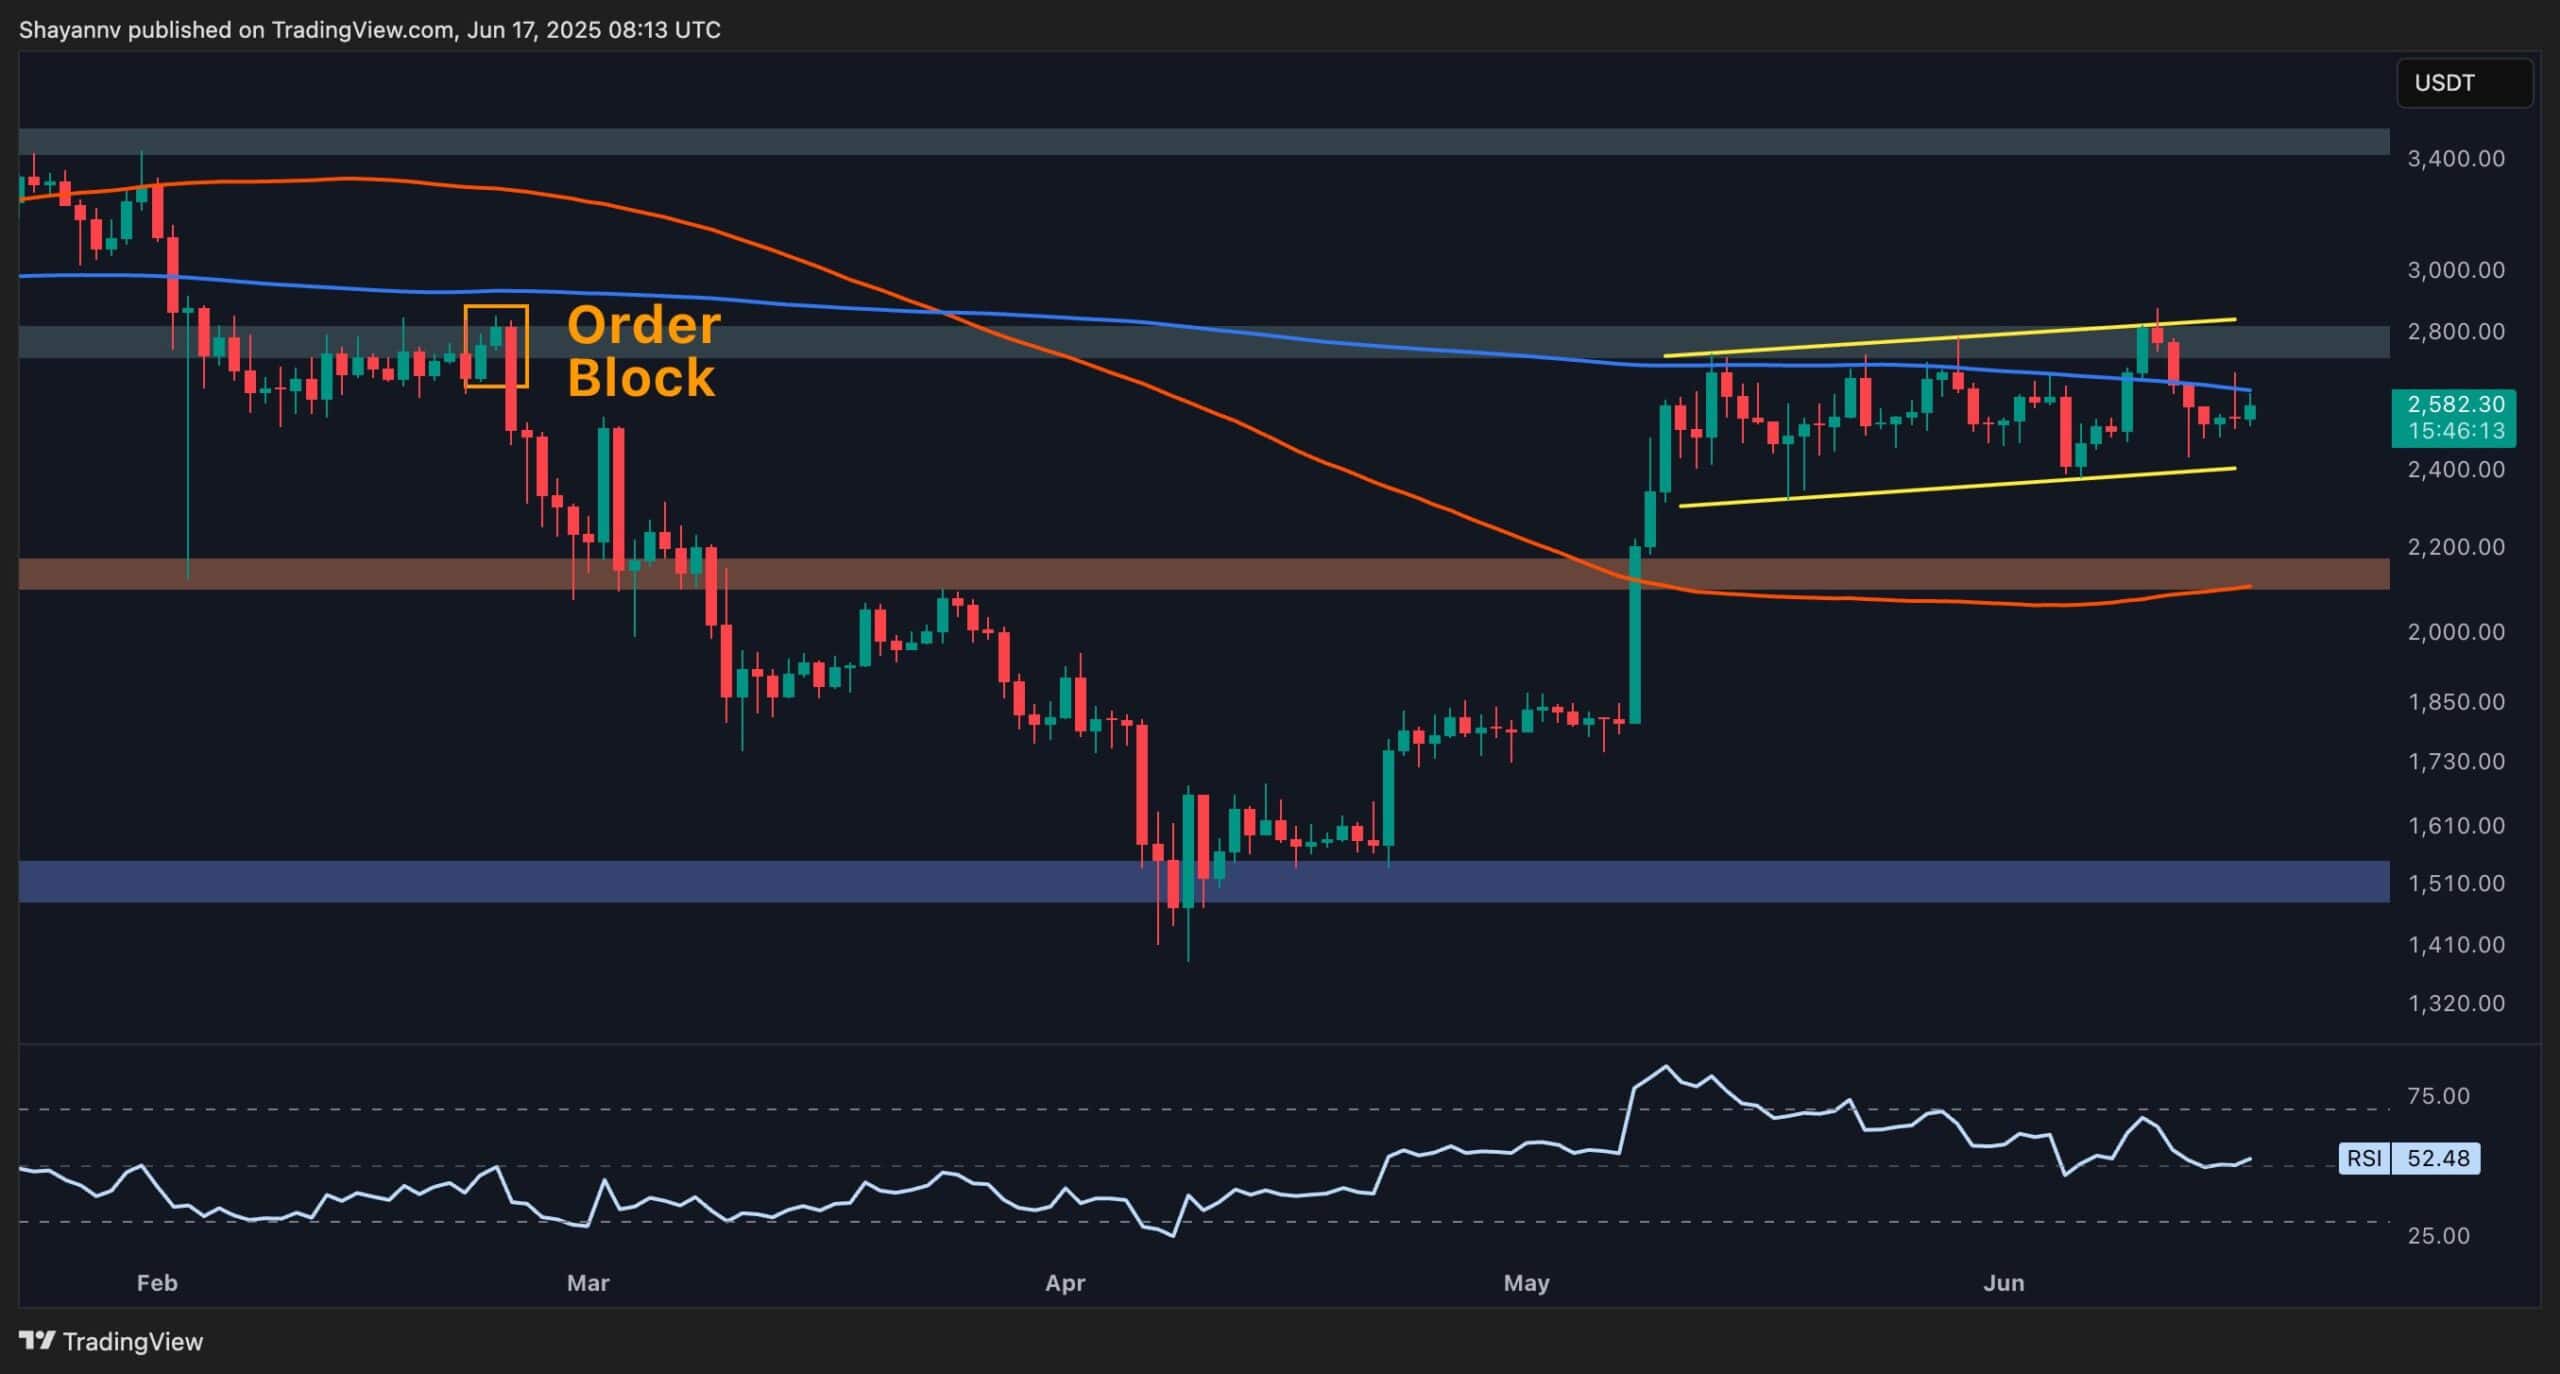
The 4-Hour Chart
In the lower timeframe, Ethereum has been repeatedly rejected from the flag’s upper boundary around $2.8K, which has proven to be a strong resistance zone. These rejections have led to a sharp retracement toward the lower edge of the flag. After reaching support near $2.4K, Ethereum rebounded slightly, retracing back into the 0.5–0.618 Fibonacci region between $2.6K and $2.7K, commonly considered a technical correction zone.
This retracement likely represents a pause before another bearish push. With selling pressure mounting, another move toward the $2.4K level is anticipated. If Ethereum fails to hold this crucial support and breaks below the flag’s lower boundary, it could confirm the beginning of a broader corrective phase.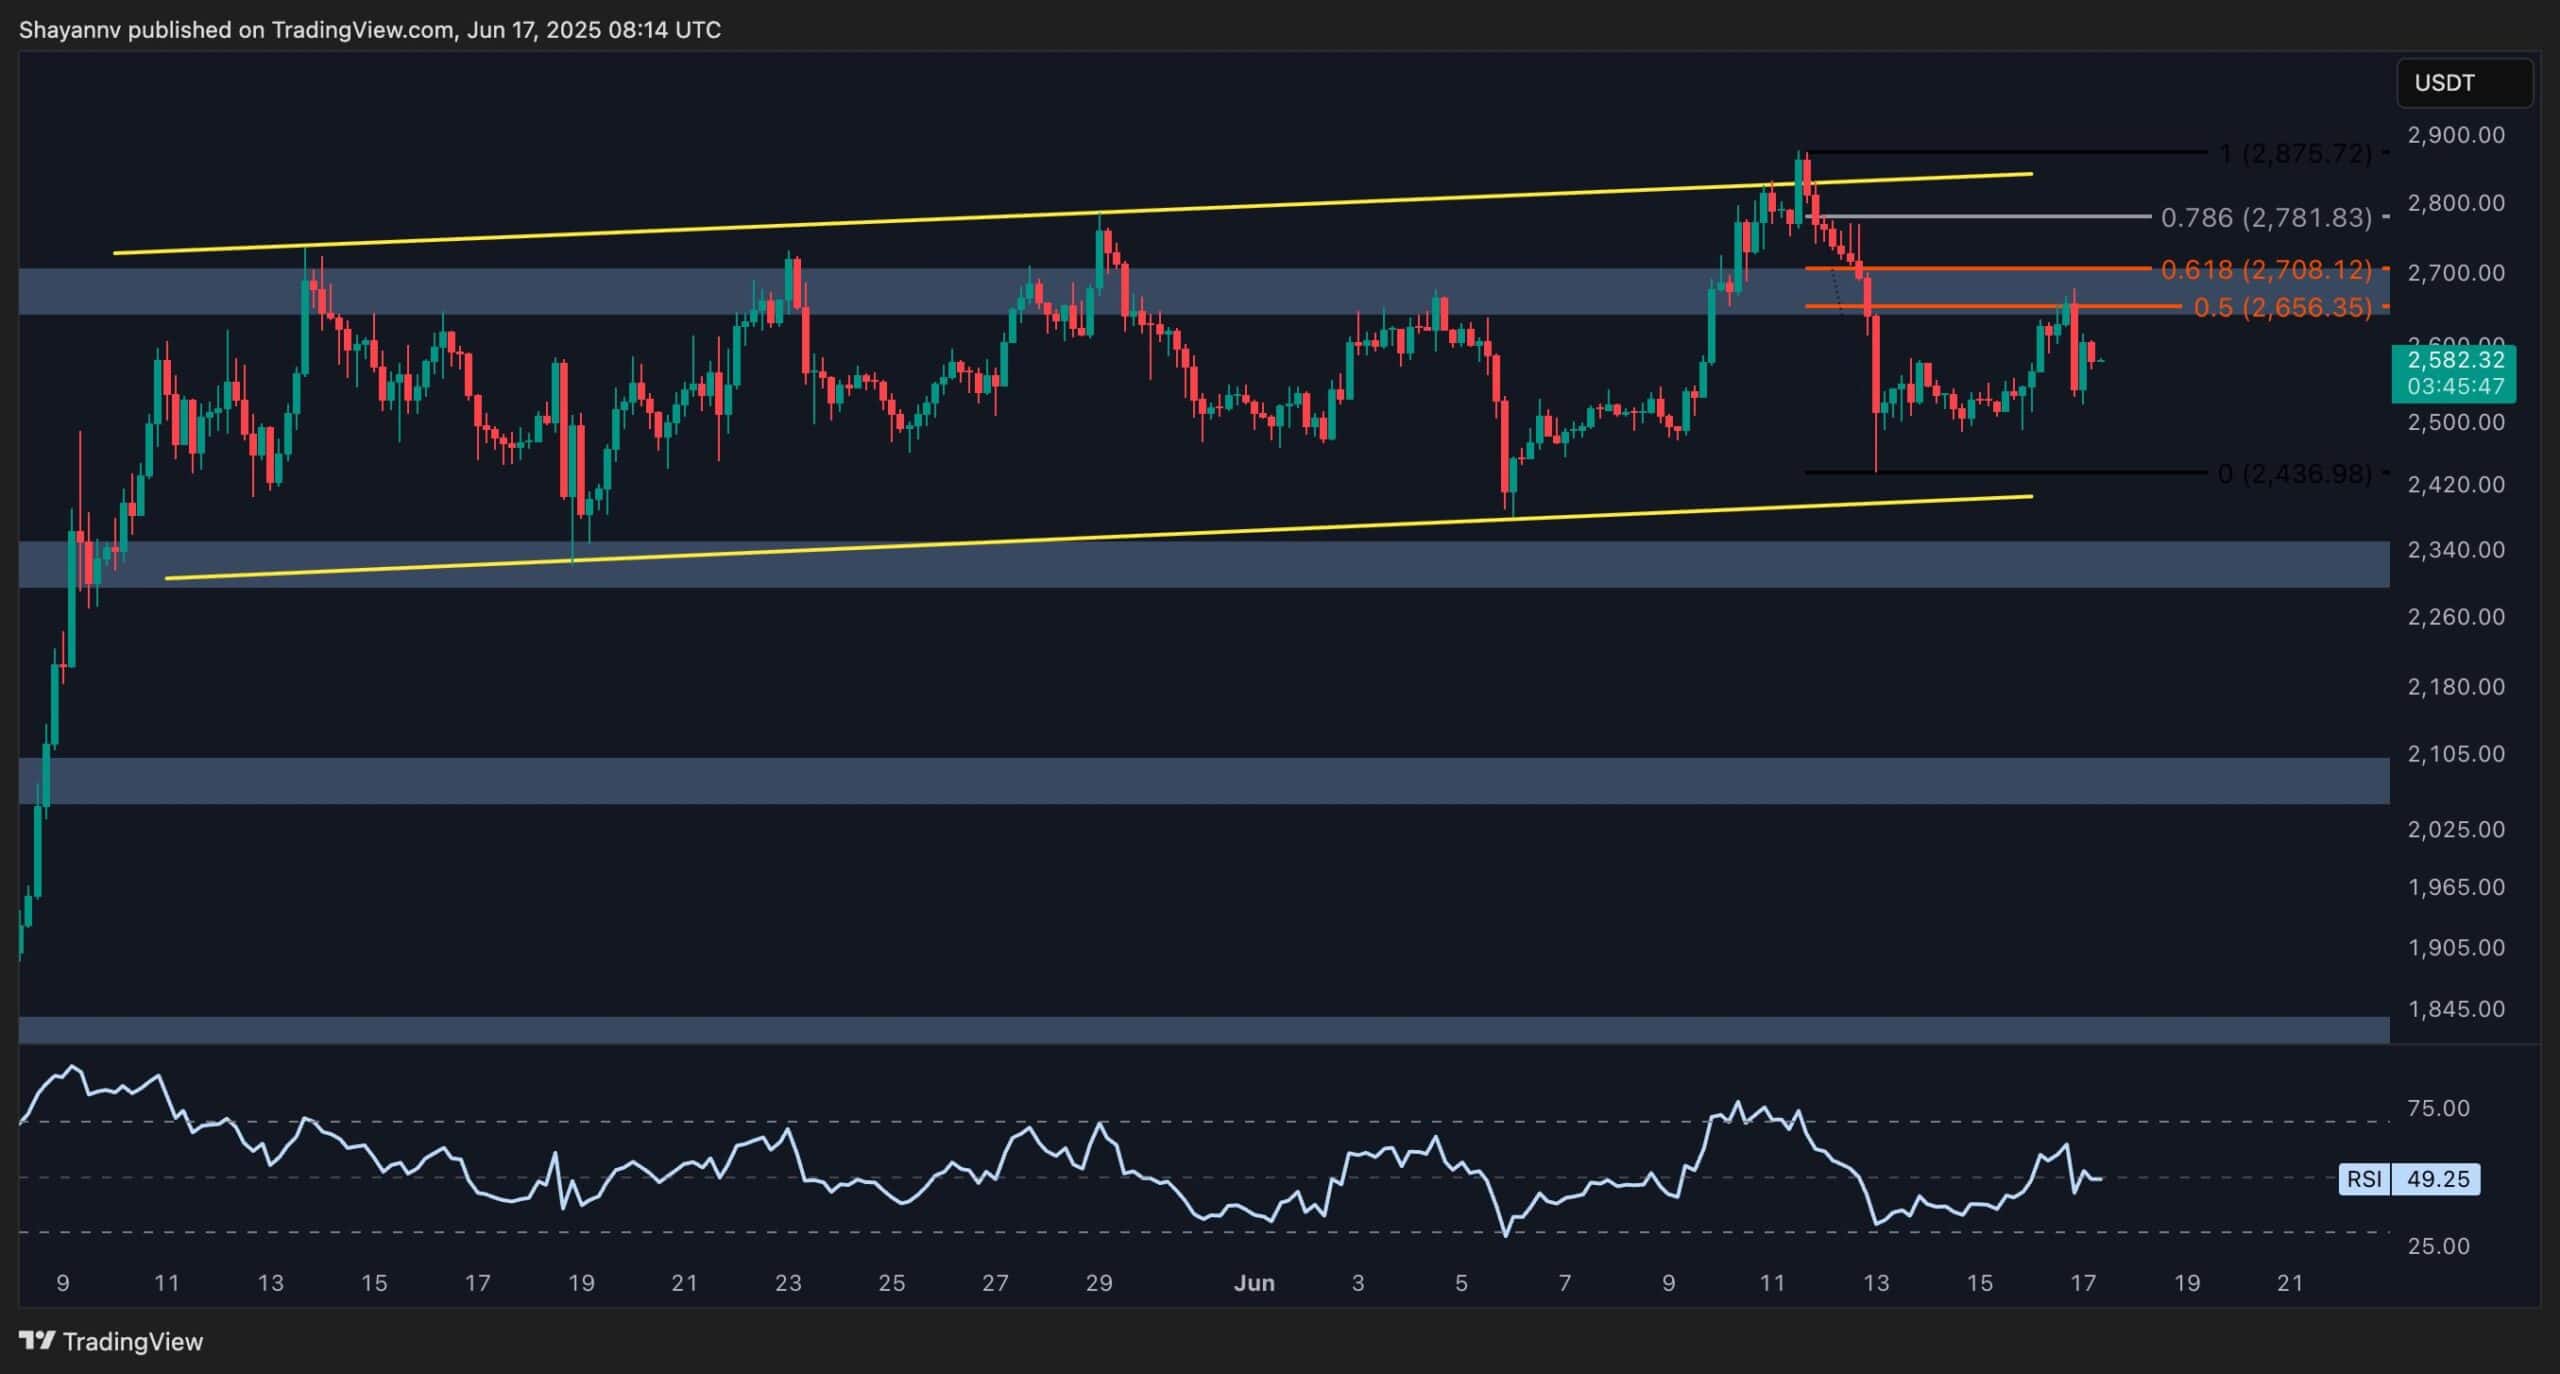
Onchain Analysis
By ShayanMarkets
The Binance liquidation heatmap continues to shed light on Ethereum’s current market behavior and possible next moves. After a sharp push upward, ETH touched the $2.8K level, a zone packed with short liquidation levels. This move triggered a wave of forced short closures, flushing liquidity, and fueling the rally.
Historically, during recovery phases or when bullish sentiment strengthens, markets often seek out these high-liquidity areas. Institutional players and smart money tend to exploit them, using forced liquidations to drive price momentum.
At present, Ethereum has pulled back and is stabilizing above the $2.4K support zone. However, the heatmap shows a notable liquidation cluster below this level, implying increased vulnerability to a downside sweep. This could attract strategic moves by large players aiming to trigger stop-hunts or accumulate at better prices.
In the short term, the $2.4K support remains a key level to watch. If it holds, a rebound could follow. If it breaks, expect a liquidity-driven dip toward the next cluster of stops lying just below.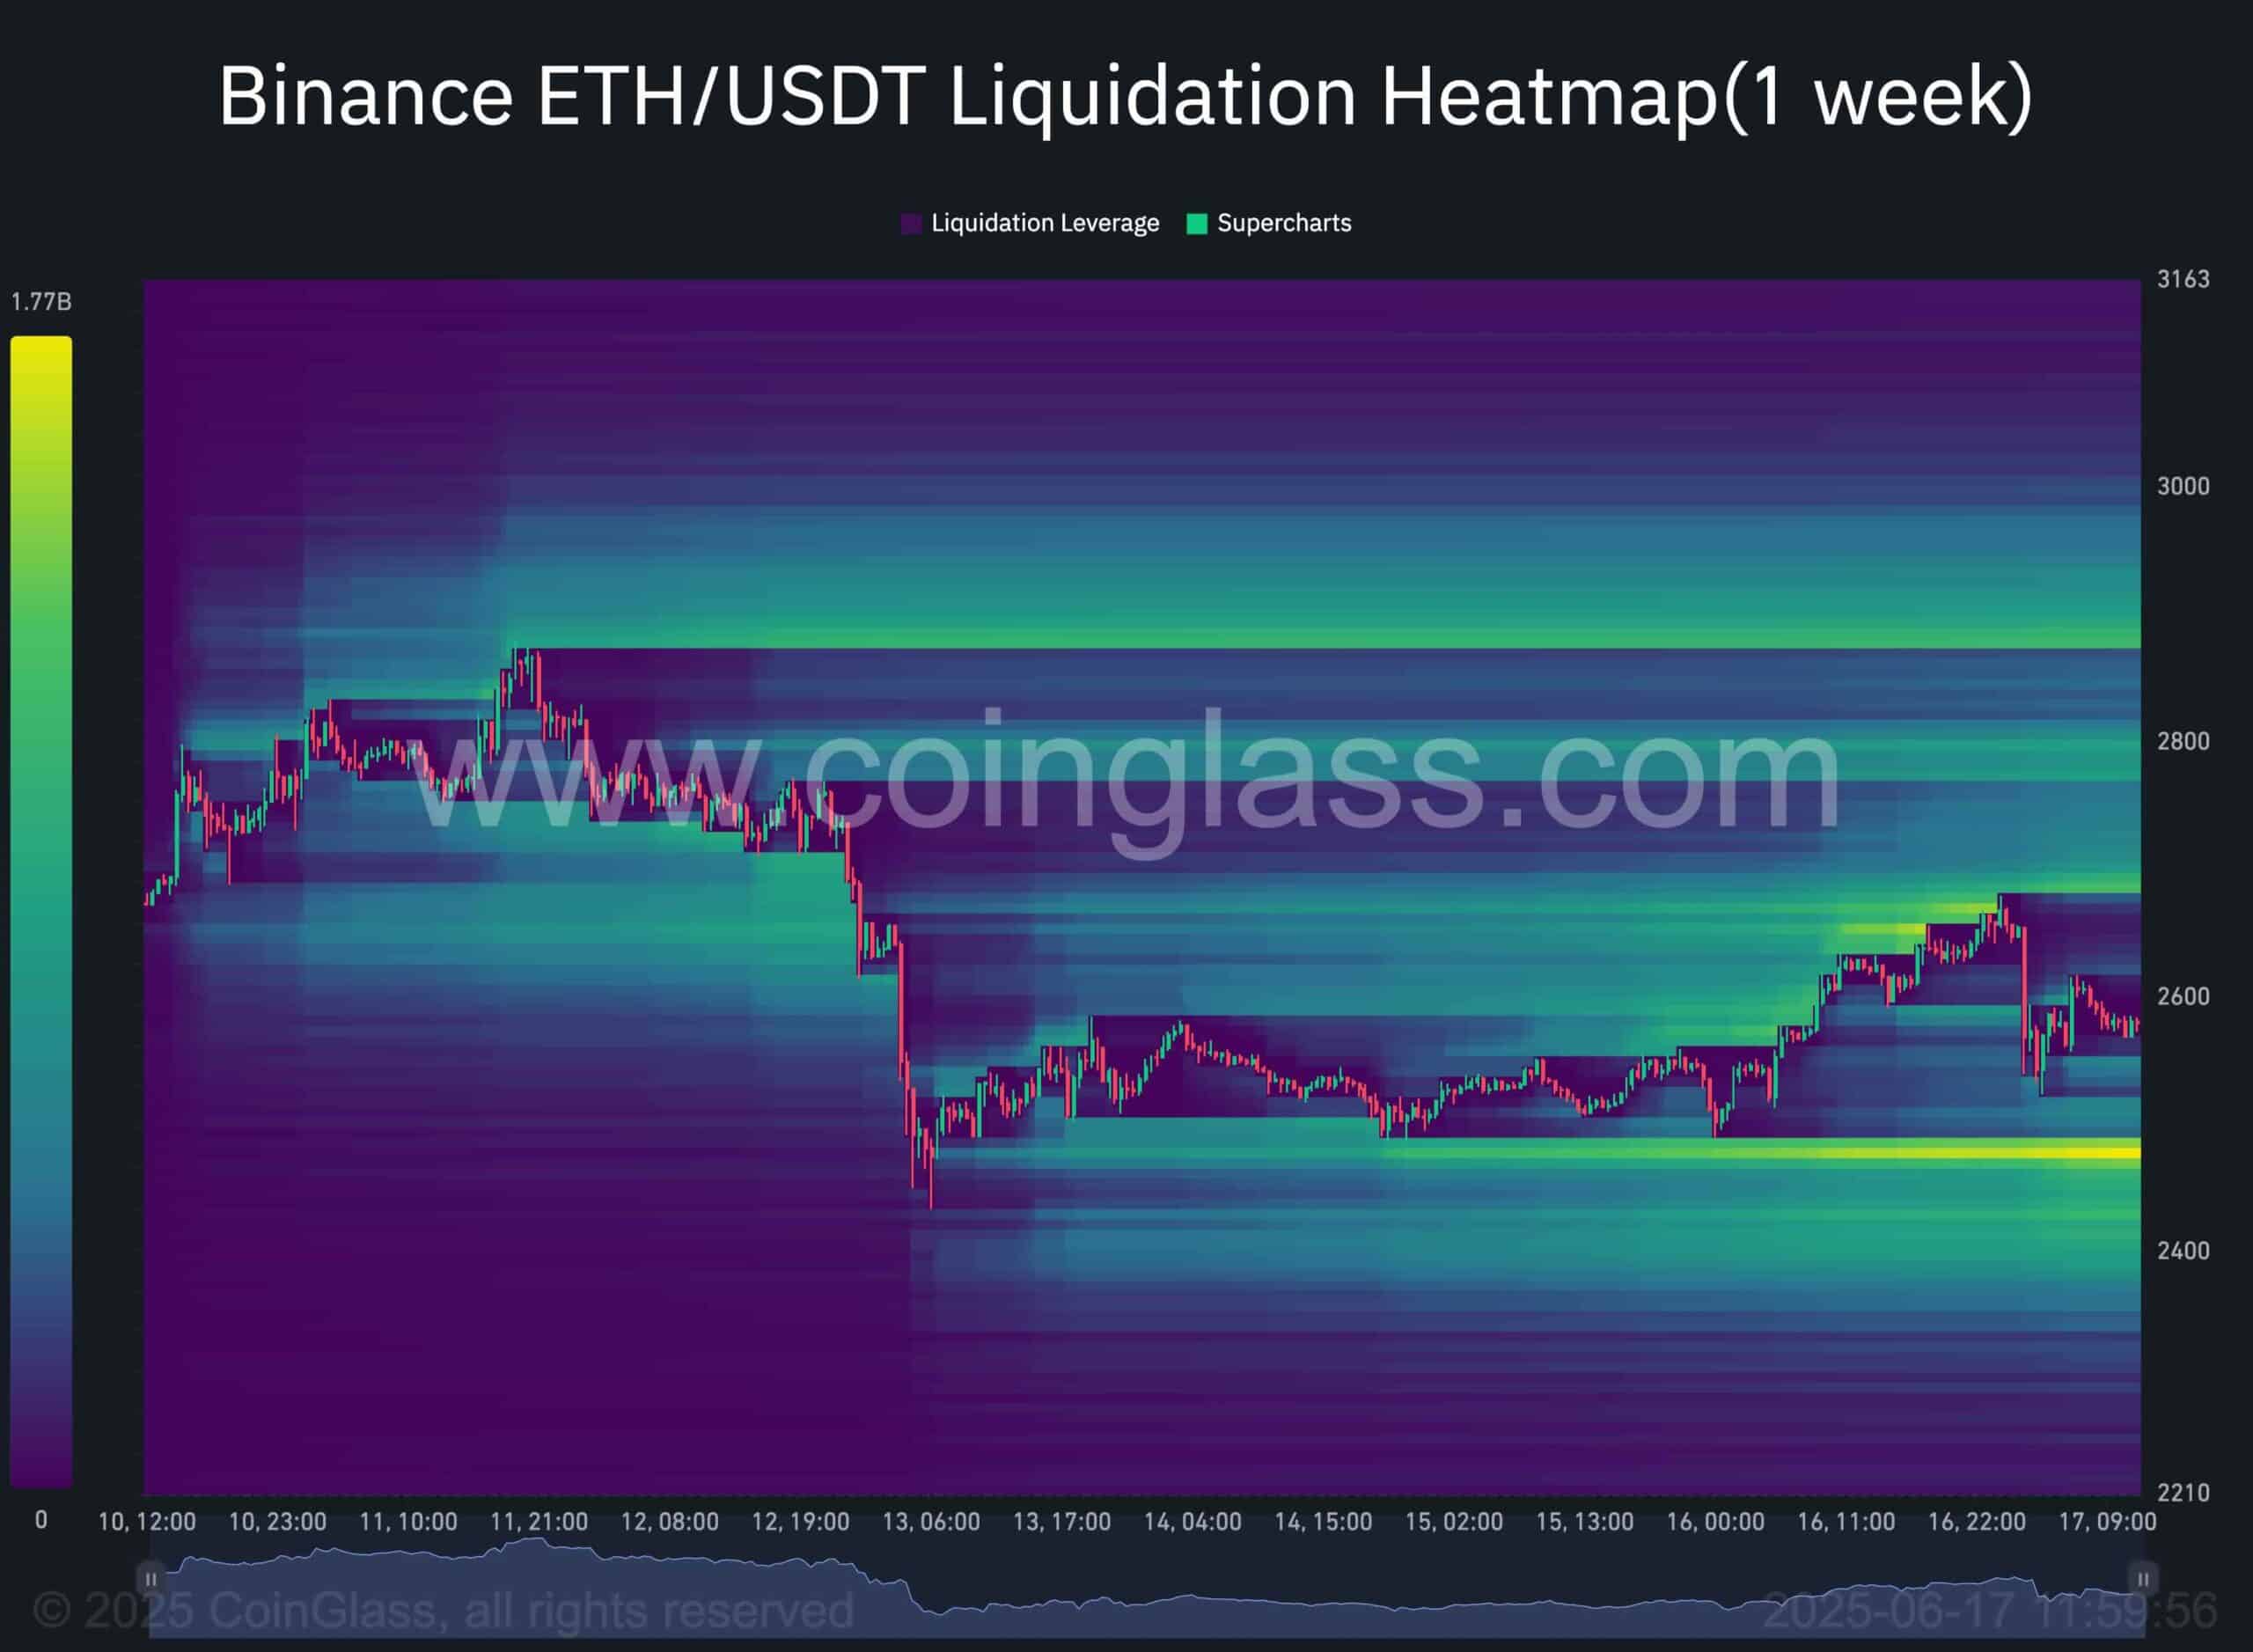
The post Ethereum Price Analysis: What’s Next for ETH After 8% Weekly Drop? appeared first on CryptoPotato.