Bitcoin is once again at a pivotal moment, trading near $106,000 after a turbulent week marked by sharp moves and high uncertainty. The leading cryptocurrency briefly lost the $100K mark following geopolitical tensions but rebounded strongly, gaining over 5% in less than 48 hours. This swift recovery highlights the extreme volatility dominating the market, with no clear trend direction established yet. Investors remain cautious, watching for signals that could define the next major move.
According to data from CryptoQuant, the average volume of Bitcoin flows—calculated by combining exchange inflows and outflows—has dropped to its lowest levels in 10 years. The drying up of liquidity suggests a broader market consolidation phase, where both buyers and sellers are waiting for clearer macro or technical signals.
While reduced exchange activity often points to investor indecision, it can also indicate that a supply squeeze is building in the background, especially if large holders are moving coins into cold storage. As Bitcoin holds just above key support, the combination of low liquidity and rising tension could spark the next explosive move in either direction.
Bitcoin Faces Pivotal Moment Amid Divided Market Outlook
Bitcoin is once again under the spotlight as it navigates one of its most critical technical and macroeconomic junctures of the year. After plunging below the $100,000 level during the weekend following the US military strike on Iran’s nuclear facilities, BTC has since rebounded, reclaiming key support levels above $105,000 after a ceasefire was announced. This rapid recovery underscores the extreme volatility gripping the crypto market, but also highlights the uncertainty surrounding Bitcoin’s next move.
At current levels—roughly 5% below its all-time high—Bitcoin appears stable on the surface but is facing a major test of strength. While some analysts anticipate a breakout toward new record highs, others warn that the lack of momentum could signal a deeper retrace below the psychological $100K mark. Price structure remains intact for now, but the absence of a clear trend direction is keeping investors on edge.
Top analyst Axel Adler provided key data that adds to the complexity. According to his outlook, the average volume of Bitcoin flows on centralized exchanges—combining both inflows and outflows—has dropped to just 40,000 BTC per day. This is the lowest level seen in a decade.
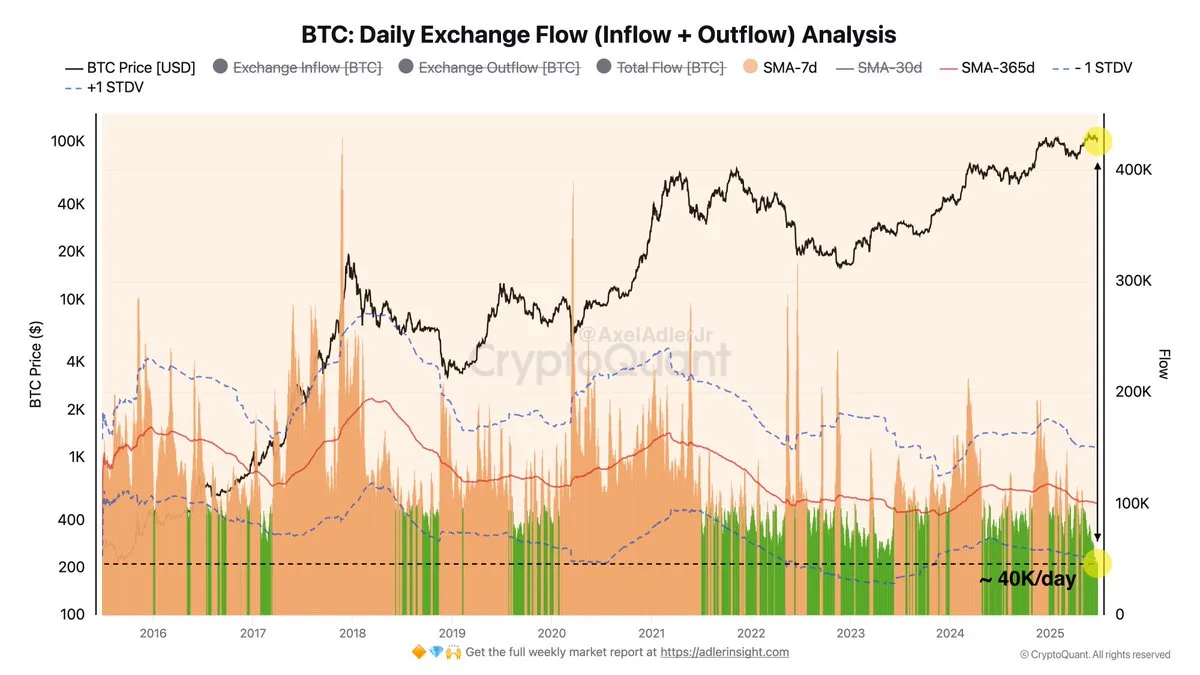
A significant portion of Bitcoin has moved off exchanges, indicating strong long-term holding behavior but also signaling a potential liquidity shortage. If demand returns while supply remains constrained, Bitcoin could experience sharp upward price pressure. Until then, the market continues to hover in a state of cautious anticipation.
BTC Price Analysis: Testing Resistance Around $109K Level
Bitcoin is showing renewed strength on the 3-day timeframe, trading at $107,029 after rebounding sharply from last week’s lows around $98,000. The chart highlights two key horizontal levels—$103,600 acting as solid support, and $109,300 as strong resistance. This range has become the core consolidation zone for BTC since early May, with multiple rejections and failed breakdowns showing the market’s indecision.
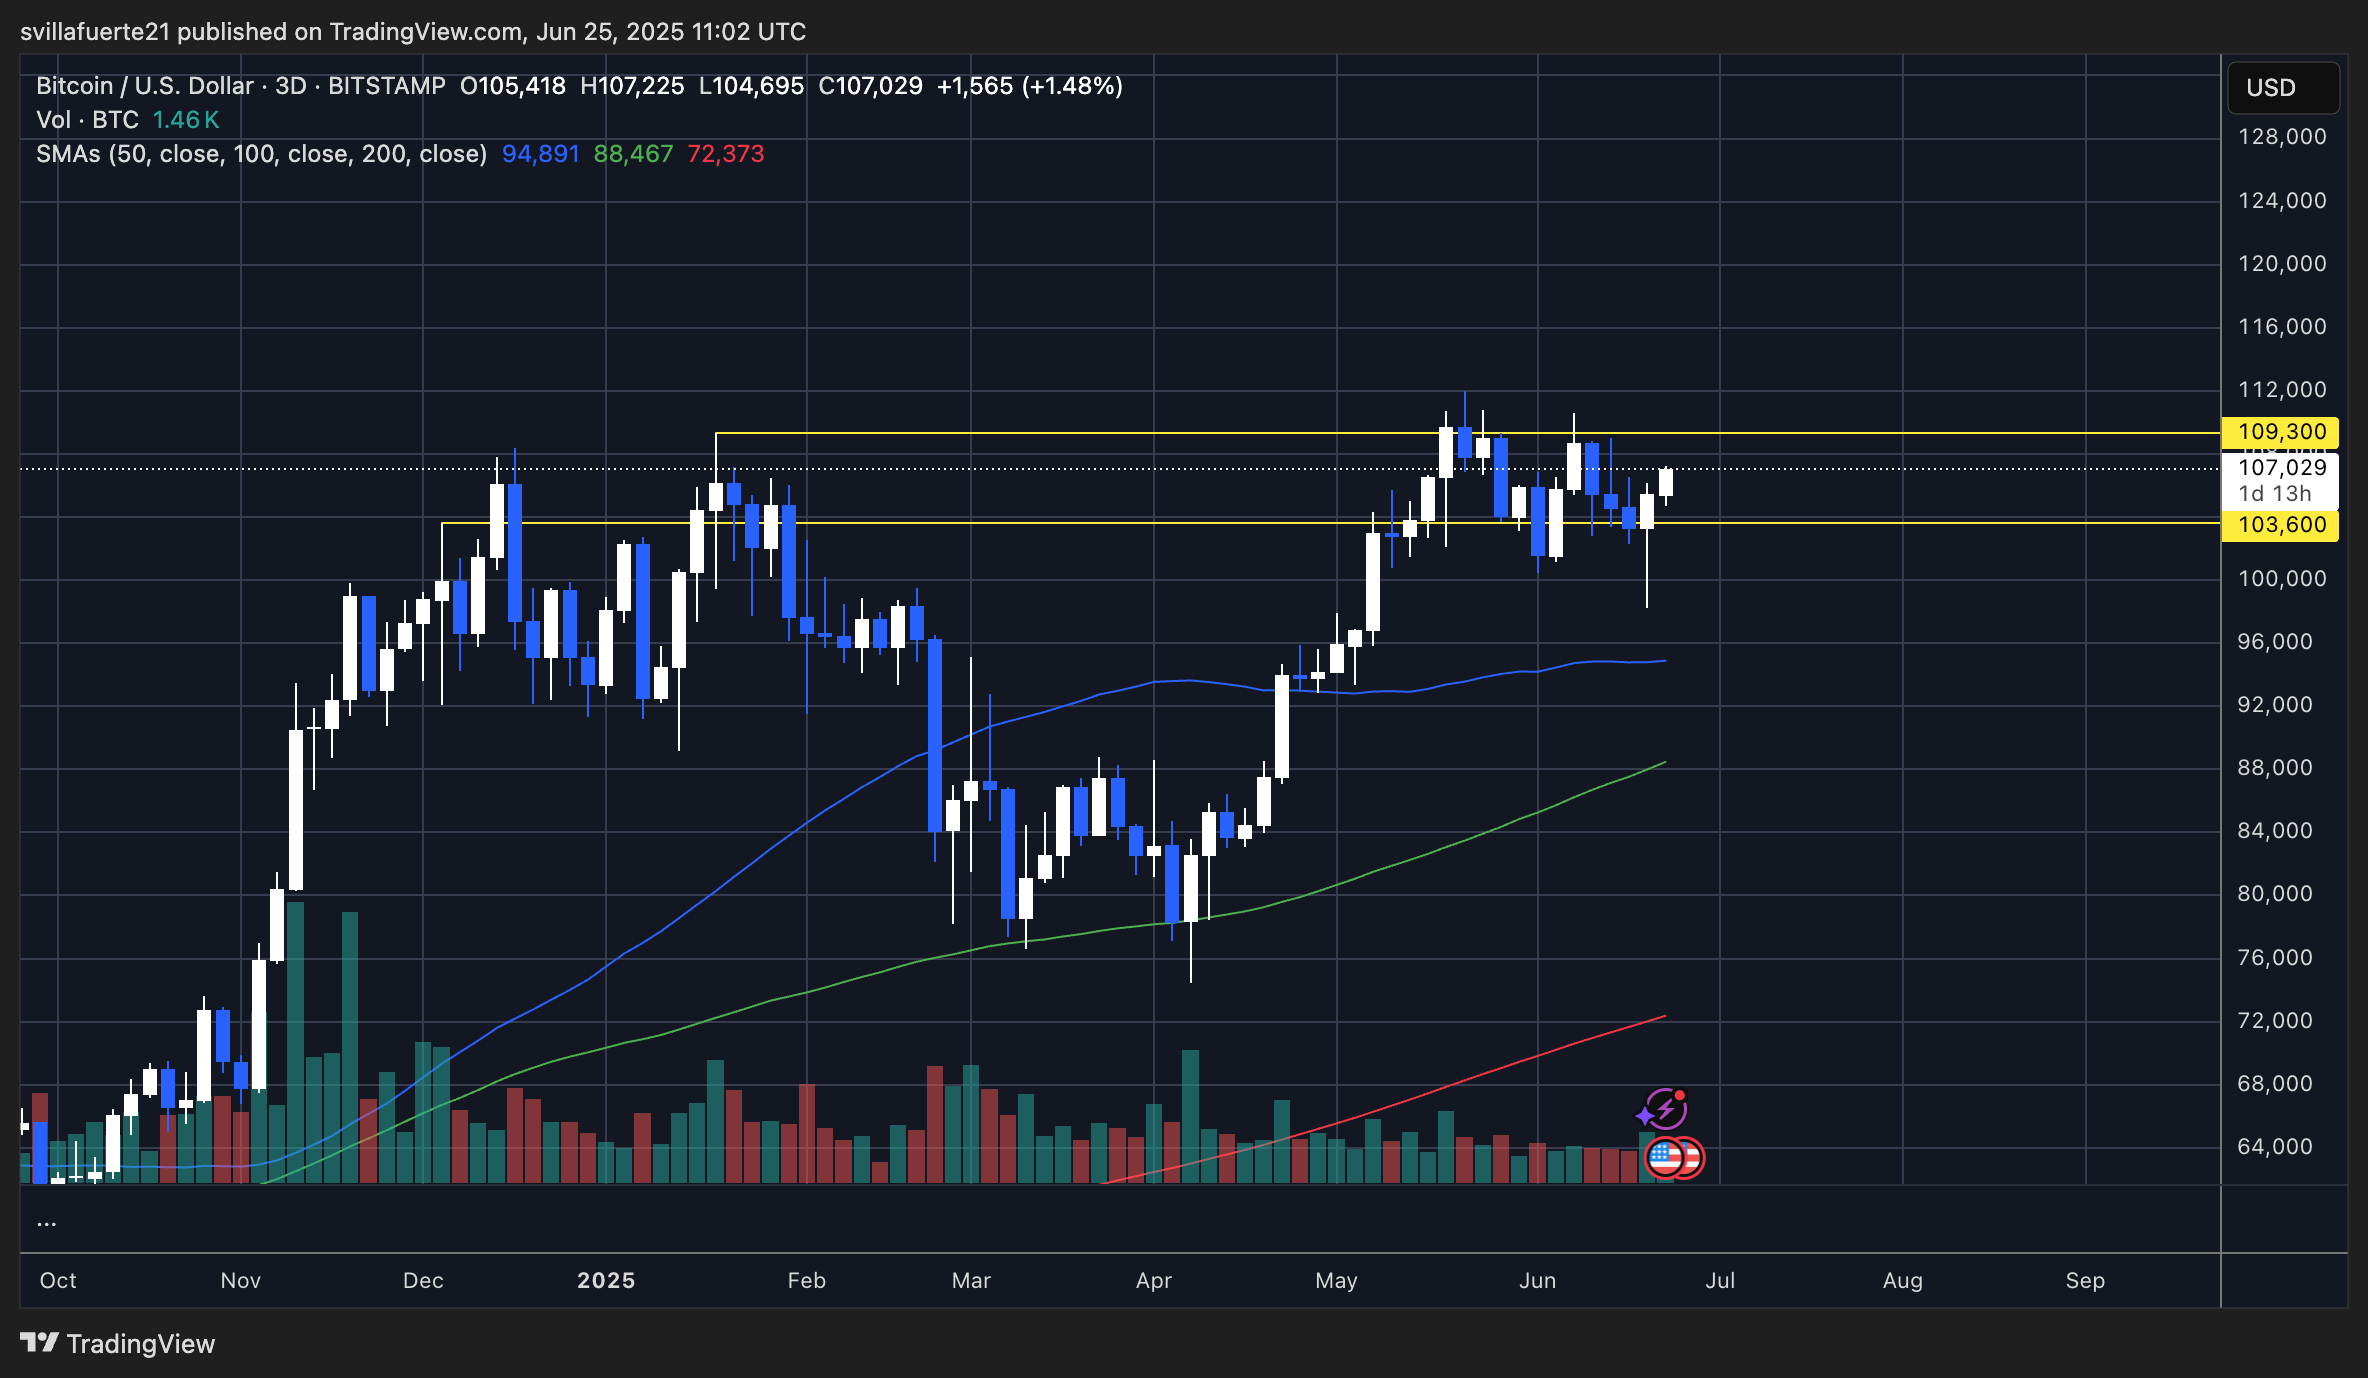
Price is now pressing toward the upper boundary of this range after a successful reclaim of the 50-day moving average (blue), which sits near $94,891. Notably, the 100-day (green) and 200-day (red) moving averages remain well below current prices, indicating that the long-term trend is still bullish despite recent volatility.
Volume remains relatively stable, but lacks the explosive conviction typically seen during breakout rallies. For Bitcoin to push decisively into new highs, bulls must flip the $109,300 resistance into support. A clear breakout above this level could initiate a new leg higher toward uncharted territory.
Until then, BTC appears to be locked in a controlled consolidation, with $103,600 offering a reliable support base. As long as this level holds, the structure favors the bulls, but a rejection at resistance could invite another round of uncertainty.
Featured image from Dall-E, chart from TradingView