
Ethereum’s price performance over the past 48 hours has been relatively subdued, suggesting that the altcoin’s recent rally may be cooling. Over the past 24 hours, Ethereum has dipped by just over 1%, with Binance showing a 1.22% decline and CoinGecko reporting a slightly steeper 1.81% drop.
Intraday trading activity has been confined to a narrow band between $2,478 and $2,555, according to data from CoinGecko. However, beneath the surface, a different narrative is unfolding with steady inflows into Ethereum-based Spot ETFs.
Strong Inflows Into Spot Ethereum ETFs
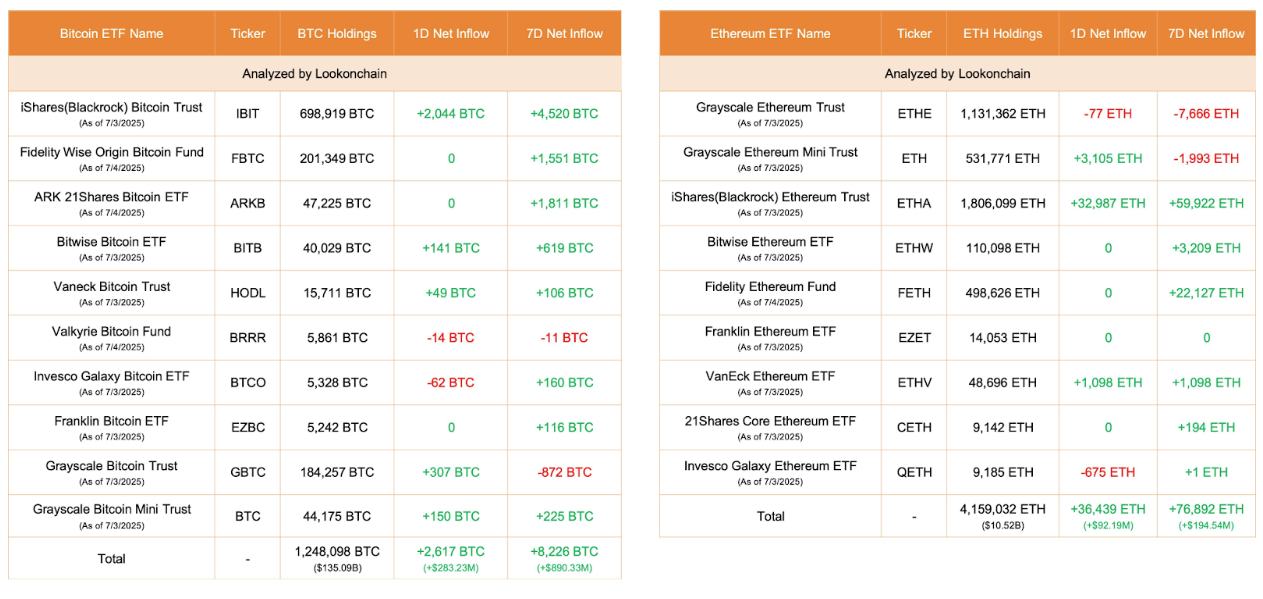
According to updated data from on-chain analytics platform Lookonchain, US-based Ethereum ETFs recorded a net inflow of 36,439 ETH on July 4, valued at approximately $92.19 million. This builds on a solid showing the day prior on July 3, when daily net inflows into the ETFs totaled $148.57 million.
Spot Ethereum ETFs were on a roll of inflows in the just concluded week, with the latest Friday inflow making up four days of inflows out of five. The only day of outflow was on Wednesday, July 2, when the ETFs witnessed a negative netflow of $1.82 million.
The lion’s share of Friday’s inflows came from the iShares (BlackRock) Ethereum Trust, which added 32,987 ETH, equivalent to $83.46 million in value. The fund now holds a substantial 1.81 million ETH, worth over $4.57 billion. Despite the relatively flat market price, this continued accumulation shows the current state of institutional confidence in Ethereum.
Grayscale’s Ethereum Mini Trust also added 3,105 ETH on the day, even as its larger sibling, the Grayscale Ethereum Trust (ETHE), recorded minor outflows of 77 ETH. Meanwhile, other players such as VanEck, Bitwise, and Fidelity have maintained positive inflow momentum across the week. Over a seven-day period, the total net inflow across all listed Ethereum ETFs stands at 76,892 ETH, equivalent to roughly $194.54 million.
Ethereum Price Stalls After Last Week’s Momentum
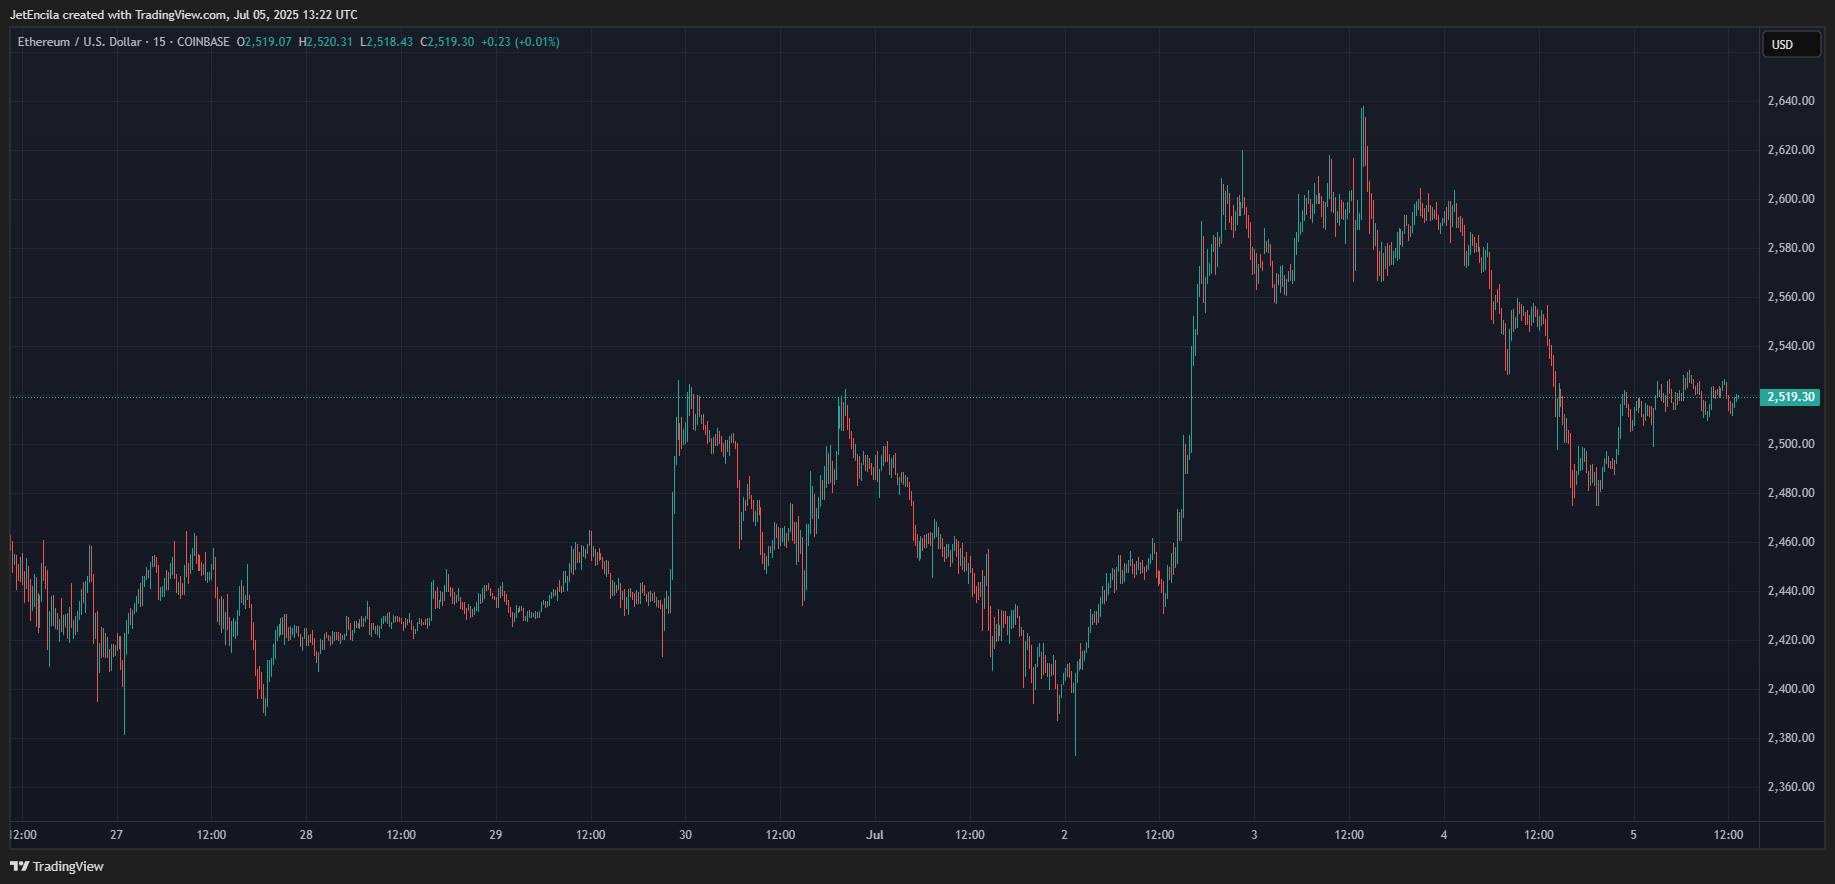
Technically, Ethereum is starting to move into a consolidation pattern with its price action in the past 48 hours. It’s hovering above support at $2,400 but below resistance in the $2,600 range. Over the past seven days, Ethereum has mostly moved in a tight range between $2,400 and $2,630, ending the week with a gain of roughly 4%. At the time of writing, Ethereum is up by 4.1% in the past seven days, according to data from CoinGecko. This outpaces Bitcoin’s 0.7% gain in the same timeframe.
Interestingly, Ethereum price action is forming what looks like a wedge pattern, according to technical analysis of the 4-hour candlestick timeframe chart. This analysis places emphasis on the resistance at $2,600, which could open up a rejection to another support level at $2,200. Many analysts are eyeing breakouts above $2,600 and $2,800 for a possible rally to $4,000, while a drop below $2,200 could trigger a pullback to the $1,750 area.
At the time of writing, Ethereum is trading at $2,515, down 1.3% in the past 24 hours.
Featured image from Unsplash, chart from TradingView